MAHINDRA MANULIFE VALUE FUND
(An open-ended equity scheme following a value
investment strategy)
 |
 |
 |
 |
 |
| Data as on 30th October 2026 |
Product Labelling: This product is suitable for investors who are seeking:
This product is suitable for investors who are seeking*:
• Capital appreciation over long term.
• Investment predominantly in a portfolio of Equity and Equity Related Instruments by following a value investment strategy.
Scheme Riskometer*
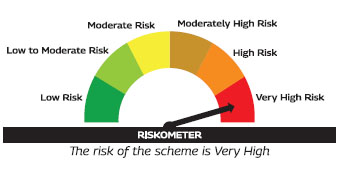
Scheme Benchmark Riskometer*
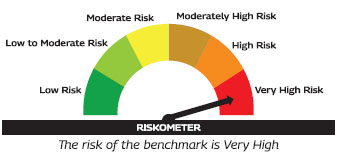
As per AMFI Tier I Benchmark i.e. Nifty 500 TRI
*Investors should consult their financial advisors if in doubt about whether the product is suitable for them.
 Fund Details
| Date of Inception / Allotment | : March 3, 2025 |
| Benchmark Name | : Nifty 500 TRI (First Tier Benchmark) |
| NAV as on October 30, 2026: |
| NAV/Unit | Regular Plan (In Rs.) | Direct Plan (In Rs.) |
| IDCW | 11.5106 | 11.8478 |
| Growth | 11.5106 | 11.8478 |
IDCW History : Click Here
AUM as on October 30, 2026:
| Monthly AUM | : Rs 994.95 crores |
| Monthly AAUM | : Rs 1,003.51 crores |
 Fund Manager Details
|
Name of Fund Manager: Mr. Krishna Sanghavi | |
| Total Experience | : 29 years |
| Managing Since | : 3-Mar-25 |
| Mr. Vishal Jajoo | |
| Total Experience | : 19 years |
| Managing Since | : 3-Mar-25 |
 Minimum Investment
Lumpsum Amount:
Rs. 1,000 and in multiples of Re.
1/- thereafter
Minimum Weekly & Monthly SIP Amount:
Rs 500
and in multiples of Re 1 thereafter
Minimum Weekly & Monthly SIP Installments: 6
Minimum Quarterly SIP Amount:
Rs 1,500 and in
multiples of Re 1 thereafter
Minimum Quarterly SIP installments: 4
 Load Structure
Exit Load:
-An Exit Load of 0.5% is payable if Units are
redeemed / switched-out up to 3 months from the
date of allotment;
-Nil if Units are redeemed / switched-out after 3
months from the date of allotment.
-Redemption /Switch-Out of Units would be done on
First in First Out Basis (FIFO).
 Expense Ratio
Base Expense Ratio1
as on October 30, 2026:
Regular Plan : 1.93%
Direct Plan : 0.59%
1Base Expense Ratio excludes Brokerage Fees, Transaction Cost and other applicable statutory levies. For details of the Total Expense Ratio (TER), please refer the TER disclosure available on the website by visiting the link - https://www.mahindramanulife.com/downloads#mandatory-disclosures
 Quantitative Measures /
Risk Measures
| Standard Deviation | : NA |
| Beta | : NA |
| Sharpe Ratio# | : NA |
| Tracking Error (%) | : NA |
| Tracking Difference (%) | : NA |
| Information Ratio | : NA |
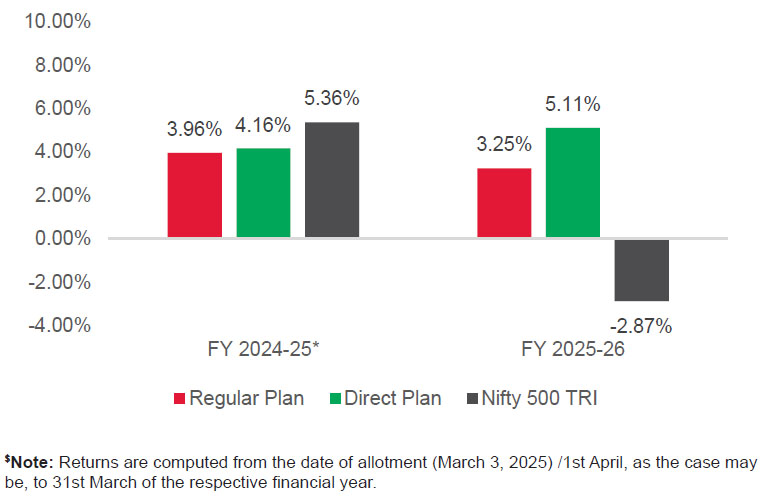
| Compounded Annualised Returns | Scheme Returns % (Regular) | Scheme Returns % (Direct) | Benchmark Returns % |
| Returns for the last 1 year | -1.76 | -0.09 | -6.85 |
| Returns for the last 3 years | NA | NA | NA |
| Returns for the last 5 years | NA | NA | NA |
| Returns since Inception | 8.84 | 10.75 | 6.99 |
Inception/Allotment date: 03-Mar-25.Past performance may or may not be sustained in future and should not be used as a basis of comparison with other investments. Since inception returns of the scheme is calculated on face value of Rs. 10 invested at inception. The performance details provided above are of Growth Option under Regular and Direct Plan. Different Plans i.e Regular Plan and Direct Plan under the scheme has different expense structure.
Company / Issuer |
Net Assets |
|
|---|---|---|
1. | Reliance Industries Limited | 4.10% |
2. | ICICI Bank Limited | 3.86% |
3. | Axis Bank Limited | 3.67% |
4. | HDFC Bank Limited | 3.61% |
5. | Vodafone Idea Limited | 2.89% |
6. | Life Insurance Corporation Of India | 2.70% |
7. | Oil India Limited | 2.32% |
8. | Shriram Finance Limited | 2.21% |
9. | Adani Enterprises Limited | 2.18% |
10. | JSW Energy Limited | 2.14% |
| Portfolio Turnover Ratio (Annualized) | |
| a) Equity Turnover (%) | 0.74 |
| b) Gross Exposure Turnover (%) | 0.74 |
 Risks associated with investments in Equity and Equity Related Instruments |
| Risks associated with investments in Debt and Money Market Instruments |
| Risks associated with Real Estate Investment Trust (REITs) and Infrastructure Investment Trust (InvIT) |
| Risks associated with investments in Derivatives |
| Risks attached with the use of derivatives |
| Risks associated with investment in Foreign Securities Risk associated with Securities Lending |
| Risks associated with ‘Right to limit redemptions’ |
| Risks associated with investing in Tri-party Repo (TREPS) through CCIL |
| Risks Factors associated with transaction in Units through stock exchange(s) |
| Risks associated with segregated portfolio |
| Risks Associated with Investment in Gold & Silver ETFs. |
 |
for Detailed Investment in Securities |
| |
for Allocation of Net Asset by Sectors |
| |
for Allocation of Net Asset by Asset Class |
| |
for Allocation of Net Assets by Region / Country |
Major Changes w.r.t previous month -
| Name of securities added/Increased | Name of securities deleted/reduced | Total Weightage in %age |
| Shriram Finance Limited | 0.79 | |
| Vodafone Idea Limited | 0.68 | |
| Jindal Saw Ltd | -0.39 | |
| ICICI Bank Ltd | 0.28 | |
| Bandhan Bank Limited | -0.25 | |
| Adani Enterprises Ltd | -0.22 | |
| Oil India Ltd | 0.07 | |
| JSW Energy Ltd | 0.07 | |
| Axis Bank Ltd | 0.05 | |
| Life Insurance Corporation Of India | -0.03 |
| Change in | Previous Month | Current Month |
| Direct | 0.58% | 0.59% |
| Regular | 1.92% | 1.93% |
1Base Expense Ratio excludes Brokerage Fees, Transaction Cost and other applicable statutory levies. For details of the Total Expense Ratio (TER), please refer the TER disclosure available on the website by visiting the link - https://www.mahindramanulife.com/downloads#mandatory-disclosures
| Change in | Previous Month | Current Month |
| Scheme | NA | NA |
| Benchmark | NA | NA |
| Quantitative Measures /Risk Measures | Brief description/ Inference of the Quantitative measure | |
| 1 | Standard Deviation | Standard deviation is a statistical tool that measures the deviation or dispersion of the data from the mean or average. When seen in mutual funds, it tells you how much the return from your mutual fund portfolio is straying from the expected return, based on the fund’s historical performance. |
| 2 | Beta | Beta is a measure of an investment’s volatility in comparison to the market. Beta of less than 1 means that the security will be less volatile than the market. A beta of greater than 1 implies that the security’s price will be more volatile than the market. |
| 3 | Sharpe Ratio | The Sharpe Ratio, is measure of risk-adjusted returns. It is calculated using standard deviation and excess return to determine reward per unit of risk. |
| 4 | Information Ratio | Measures the consistency of excess returns generated over the benchmark relative to tracking error. A higher ratio indicates better risk-adjusted benchmark outperformance. |
| 5 | Portfolio Turnover Ratio | Measures the extent of purchase and sale of securities in the portfolio during a specified period. A higher portfolio turnover ratio indicates more frequent trading and portfolio rebalancing. |
| Important Weblinks | ||
| 1 | Video Explainer | Click here for a video providing simplified explanation of the Fund Factsheet along with explanation to various terminologies used. |
| 2 | Calculation/Methodology | Click here for various mathematical parameters and their respective calculation methodology/formulae. |
| 3 | Detailed Risk Factors | Click here for various risk factors associated with the Scheme. |
| 4 | Scheme Information Document (SID) |
Click here
Link for SID on AMC website.
 |
| 5 | Investor Services | https://www.mahindramanulife.com/contact-us |
| 6 | Grievance submission and redressal | https://www.mahindramanulife.com/contact-us |
Additional Disclosure
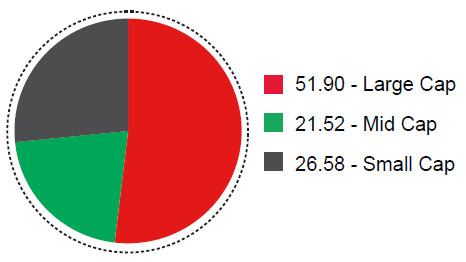
As per the latest Market Capitalisation
data provided by AMFI (In line with the
applicable SEBI guidelines)
Data as on October 30, 2026
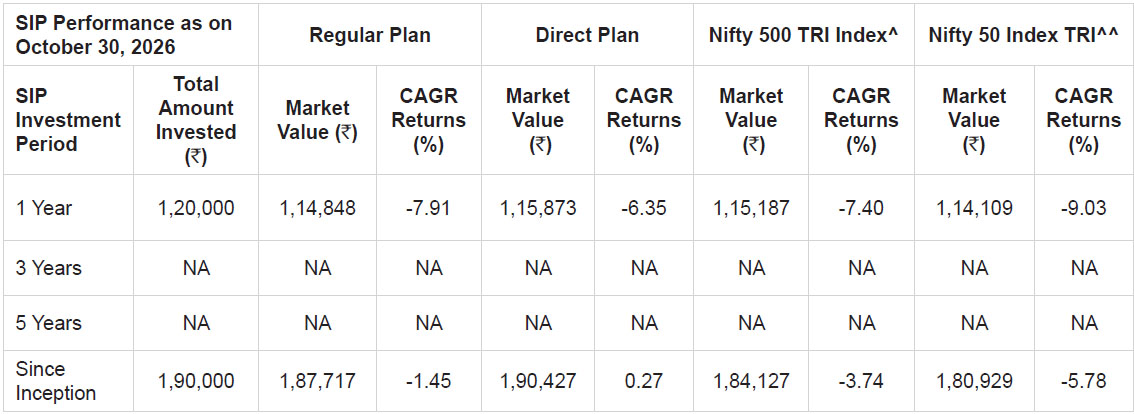
^Benchmark ^^Additional Benchmark. CAGR – Compounded Annual Growth Rate. Inception/Allotment date: 03-Mar-25. Past performance may or may not be sustained in future and should not be used as a basis of comparison with other investments. Returns greater than 1 year period are compounded annualized. For SIP returns, monthly investment of equal amounts invested on the 1st business day of every month has been considered. CAGR Returns (%) are computed after accounting for the cash flow by using the XIRR method (investment internal rate of return).
Past Performance is not an indicator or guarantee of future results