MAHINDRA MANULIFE FLEXI CAP FUND
(An open ended dynamic equity scheme investing
across large cap, mid cap, small cap stocks)
 |
 |
 |
 |
 |
| Data as on 31st December 2025 |
||||
| Investment Objective | The investment objective of the Scheme is to generate long term capital appreciation by investing in a diversified portfolio of equity and equity-related securities across market capitalization. However, there can be no assurance that the investment objective of the Scheme will be achieved. |
| Fund Features |
|
| Fund Manager and Experience | Fund Manager: Ms. Fatema Pacha Total Experience: 18 years Experience in managing this fund: 4 years and 4 months (Managing since August 23, 2021) |
| Date of allotment | August 23, 2021 |
| Benchmark | NIFTY 500 TRI |
| Options | Growth; IDCW |
| IDCW Sub-options | IDCW Reinvestment & IDCW Payout |
| Minimum Application Amount: |
Rs. 1,000/- and in multiples of Re.1/- thereafter |
| Minimum Additional Purchase Amount: | Rs. 1,000/- and in multiples of Re. 1/- thereafter |
| Minimum Redemption/Switch-Out Amount: | Rs. 1,000/- or 100 units or account balance, whichever is lower |
| SIP | Rs 500
and in multiples of Re 1 thereafter 6 Rs 1,500 and in multiples of Re 1 thereafter 4 |
| Monthly AAUM as on December 31, 2025 (Rs. in Cr.): | 1,593.79 | Quarterly AAUM as on December 31, 2025 (Rs. in Cr.): | 1583.25 |
| Monthly AUM as on December 31, 2025 (Rs. in Cr.): |
1,596.73 |
| Total Expense Ratio1 as on December 31, 2025 |
Regular Plan: 2.05% Direct Plan: 0.43% 1Includes additional expenses charged in terms of Regulation 52 (6A) (b) and 52 (6A) (c) of SEBI (Mutual Funds) Regulations, 1996 and Goods and Services Tax. |
| Load Structure: | ● An Exit Load of 1% is payable if Units are redeemed / switched-out upto 3 months from the date of allotment; Nil if Units are redeemed / switched-out after 3 months from the date of allotment. Redemption /Switch-Out of Units would be done on First in First out Basis (FIFO). |
| Portfolio Turnover Ratio (Last 1 year): | 0.54 |
| Standard Deviation: | 11.43% |
| Beta: | 0.90 |
| Sharpe Ratio#: | 0.95 |
| Jenson’s Alpha : | 0.1010 |
| #Risk-free rate assumed to be 5.67% (MIBOR as on
31-12-2025) -
Source:www.mmda.org Note: As per AMFI guidelines for factsheet, the ratios are calculated based on month rolling returns for last 3 years. Data as on December 31, 2025 |
|
| NAV/Unit | Regular Plan (In Rs.) |
Direct Plan (In Rs.) |
| IDCW | 14.2374 |
15.5555 |
| Growth | 16.6101 |
17.9799 |
| IDCW: Income Distribution cum Capital Withdrawal |
||
Company / Issuer |
% of Net Assets |
||
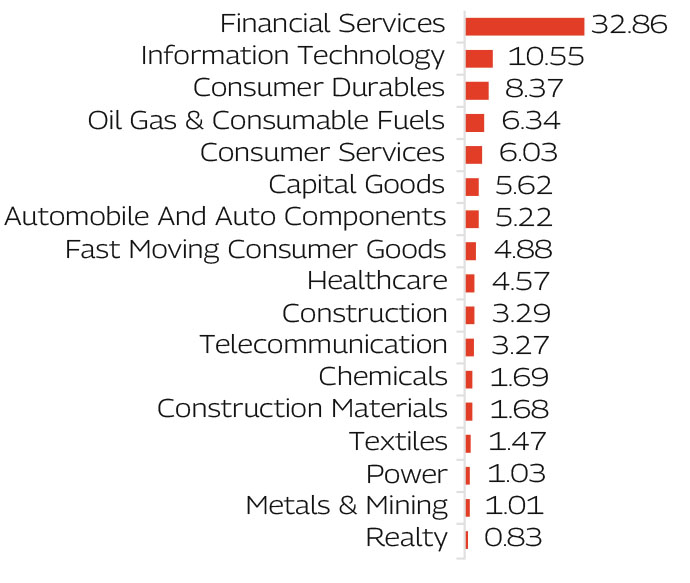
| Automobile And Auto Components | 5.22% | ||
| TVS Motor Company Limited | 1.25% | ||
| Maruti Suzuki India Limited | 1.17% | ||
| UNO Minda Limited | 1.01% | ||
| Mahindra & Mahindra Limited | 0.84% | ||
| Tata Motors Passenger Vehicles Limited | 0.52% | ||
| SKF India Limited | 0.43% | ||
| Capital Goods | 5.62% | ||
| Siemens Limited | 1.12% | ||
| Tata Motors Ltd | 1.04% | ||
| Jyoti CNC Automation Ltd | 1.00% | ||
| Bharat Heavy Electricals Limited | 0.88% | ||
| Astral Limited | 0.84% | ||
| SKF India (Industrial) Ltd | 0.46% | ||
| Kaynes Technology India Limited | 0.28% | ||
| Chemicals | 1.69% | ||
| Vinati Organics Limited | 0.79% | ||
| Navin Fluorine International Limited | 0.70% | ||
| GHCL Limited | 0.20% | ||
| Construction | 3.29% | ||
| Larsen & Toubro Limited | 3.29% | ||
| Construction Materials | 1.68% | ||
 | UltraTech Cement Limited | 1.68% | |
| Consumer Durables | 8.37% | ||
| Titan Company Limited | 1.83% | ||
| Asian Paints Limited | 1.35% | ||
| Havells India Limited | 1.23% | ||
| Voltas Limited | 1.02% | ||
| Dixon Technologies (India) Limited | 0.76% | ||
| VIP Industries Limited | 0.70% | ||
| LG Electronics India Ltd | 0.65% | ||
| Bata India Limited | 0.59% | ||
| Wakefit Innovations Limited | 0.24% | ||
| Consumer Services | 6.03% | ||
| Info Edge (India) Limited | 1.16% | ||
| Swiggy Limited | 0.99% | ||
| Jubilant Foodworks Limited | 0.97% | ||
| Devyani International Limited | 0.93% | ||
| Avenue Supermarts Limited | 0.92% | ||
| Arvind Fashions Limited | 0.63% | ||
| Lenskart Solutions Limited | 0.43% | ||
| Fast Moving Consumer Goods | 4.88% | ||
| Hindustan Unilever Limited | 2.56% | |
| Britannia Industries Limited | 1.27% | ||
| Doms Industries Limited | 1.01% | ||
| Kwality Walls (India) Limited | 0.04% | ||
| Financial Services | 32.86% | ||
| HDFC Bank Limited | 7.87% | |
| ICICI Bank Limited | 7.38% | |
| Axis Bank Limited | 3.59% | |
| Bajaj Finance Limited | 3.27% | |
| State Bank of India | 2.66% | |
| Cholamandalam Investment and Finance Company Ltd | 2.43% | ||
| IndusInd Bank Limited | 1.55% | ||
| ICICI Prudential Life Insurance Company Limited | 1.39% | ||
| Tata Capital Limited | 0.88% | ||
| SBI Cards and Payment Services Limited | 0.86% | ||
| ICICI Lombard General Insurance Company Limited | 0.78% | ||
| Billionbrains Garage Ventures Ltd | 0.20% | ||
| Healthcare | 4.57% | ||
| Cipla Limited | 1.03% | ||
| Mankind Pharma Limited | 0.97% | ||
| GlaxoSmithKline Pharmaceuticals Limited | 0.95% | ||
| Dr. Reddy's Laboratories Limited | 0.84% | ||
| Neuland Laboratories Limited | 0.78% | ||
| Information Technology | 10.55% | ||
| Infosys Limited | 4.58% | |
| Tata Consultancy Services Limited | 3.45% | |
| Tech Mahindra Limited | 1.39% | ||
| LTIMindtree Limited | 1.13% | ||
| Metals & Mining | 1.01% | ||
| Tata Steel Limited | 1.01% | ||
| Oil Gas & Consumable Fuels | 6.34% | ||
| Reliance Industries Limited | 5.53% | |
| Oil & Natural Gas Corporation Limited | 0.81% | ||
| Power | 1.03% | ||
| Tata Power Company Limited | 1.03% | ||
| Realty | 0.83% | ||
| Godrej Properties Limited | 0.83% | ||
| Telecommunication | 3.27% | ||
| Bharti Airtel Limited | 1.95% | ||
| Indus Towers Limited | 1.32% | ||
| Textiles | 1.47% | ||
| Page Industries Limited | 0.93% | ||
| Gokaldas Exports Limited | 0.54% | ||
| Equity and Equity Related Total | 98.71% | ||
| Cash & Other Receivables | 1.29% | ||
| Grand Total | 100.00% | ||
| ( Top Ten Holdings - Issuer wise) as on December 31, 2025) | |||
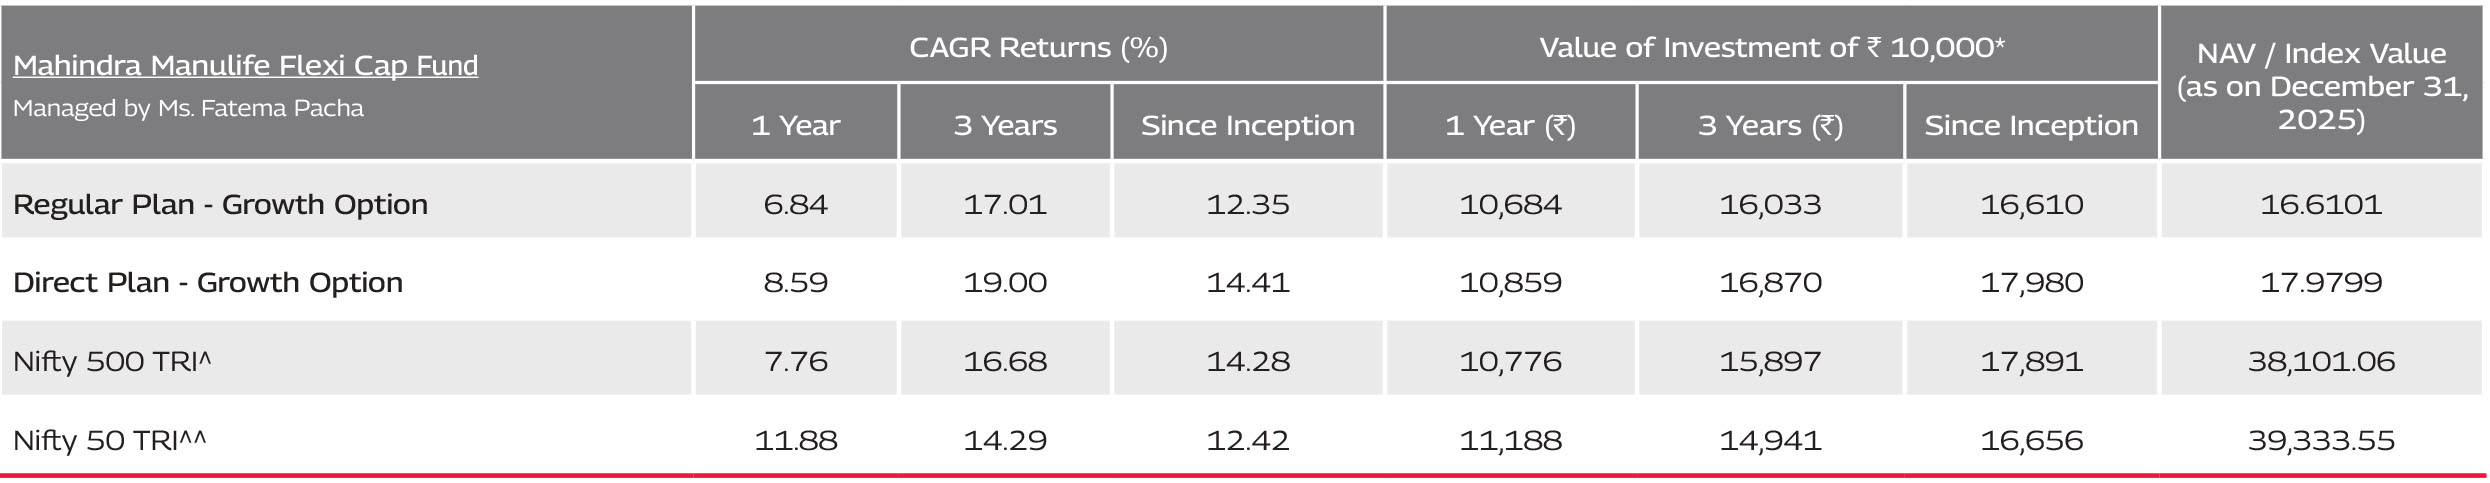
^Benchmark ^^Additional Benchmark. CAGR – Compounded Annual Growth Rate. Inception/Allotment date: 23-Aug-21 Past performance may or may not be sustained in future and should not be used as a basis of comparison with other investments.
Since inception returns of the scheme is calculated on face value of Rs. 10 invested at inception. The performance details provided above are of Growth Option under Regular and Direct Plan. Different Plans i.e Regular Plan and
Direct Plan under the scheme has different expense structure. *Based on standard investment of Rs. 10,000 made at the beginning of the relevant period.
For performance details of other schemes managed by the Fund Manager(s), please click here | Best Viewed in Landscape mode
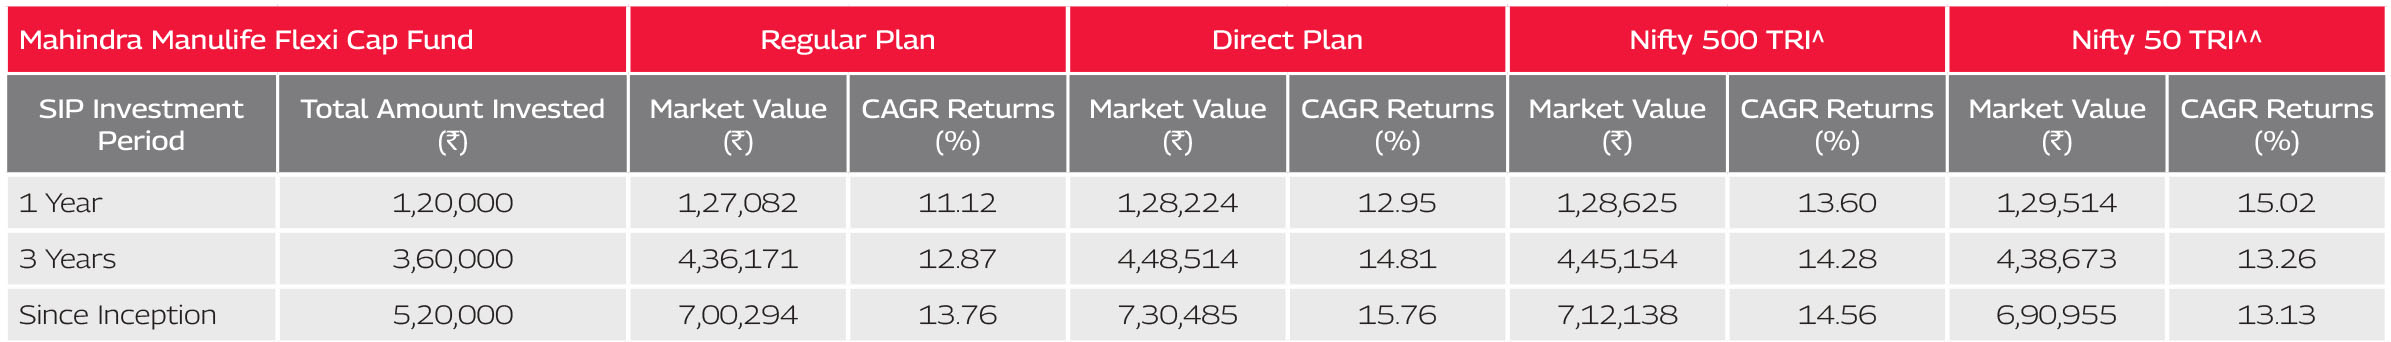
^Benchmark ^^Additional Benchmark. CAGR – Compounded Annual Growth Rate. Inception/Allotment date: 23-August-21.
Past performance may or may not be sustained in future and should not be used as a basis of comparison with other investments.
Returns greater than 1 year period are compounded annualized. For SIP returns, monthly investment of equal amounts invested on the 1st business day of every month has been considered. CAGR Returns (%) are
computed after accounting for the cash flow by using the XIRR method (investment internal rate of return).
For SIP Performance please click here | Best Viewed in Landscape mode
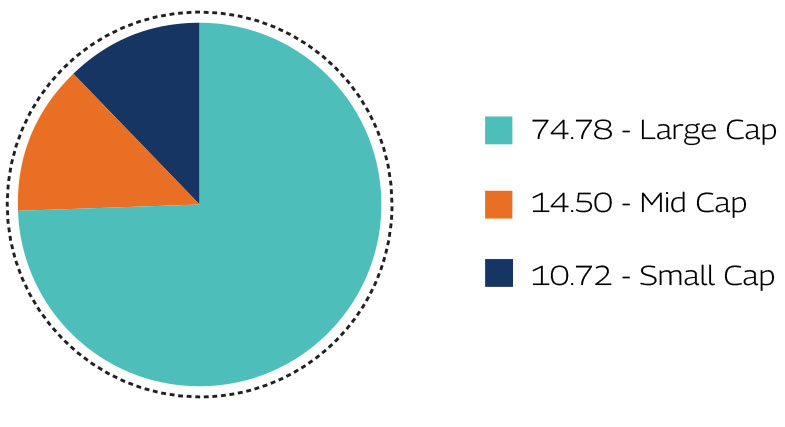
As per the latest Market Capitalisation data provided by AMFI (In line with the applicable SEBI guidelines)
Record Date |
Plan(s) / Option(s) |
IDCW |
Face Value |
Cum-IDCW NAV |
(Rs. per unit) |
(Rs. per unit) |
(Rs. per unit) |
||
14-Mar-24 |
Regular IDCW |
1.00 |
10 |
14.2271 |
14-Mar-24 |
Direct IDCW |
1.00 |
10 |
14.9457 |
13-Mar-25 |
Regular IDCW |
1.00 |
10 |
13.3638 |
13-Mar-25 |
Direct IDCW |
1.00 |
10 |
14.3281 |
Pursuant to payment of IDCW, the NAV of the IDCW Option(s) of the Scheme/Plan(s) falls to the extent of payout and statutory levy, if any. Past performance may or may not be sustained in future and should not be used as a basis for comparison with other investments. For complete list of IDCWs, visit www.mahindramanulife.com.
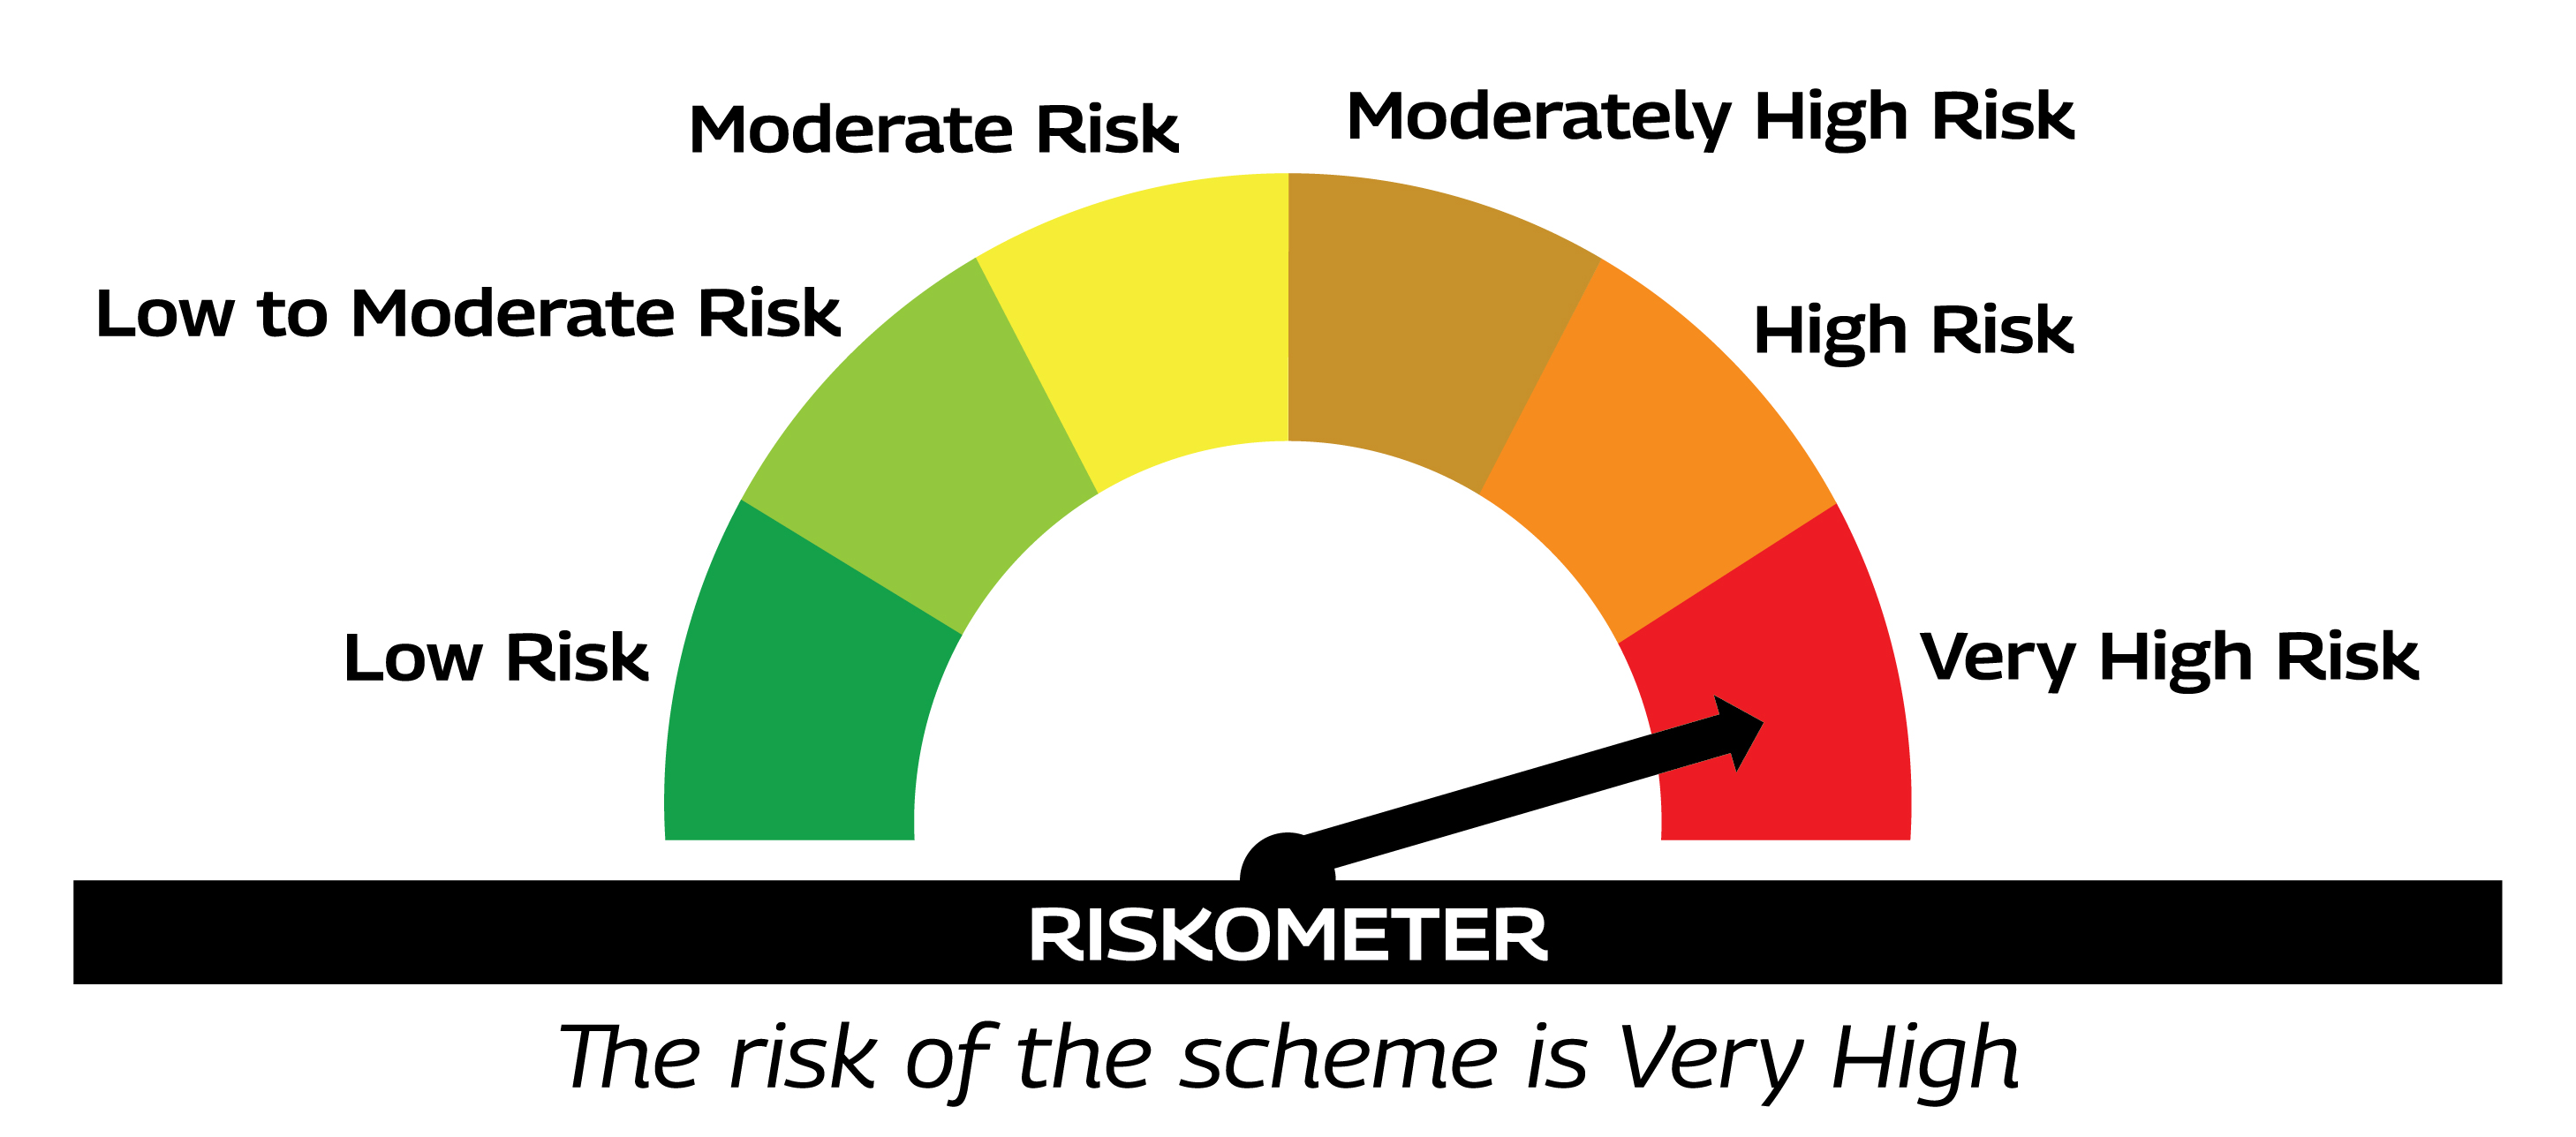
Product Suitability
|
|
| This Product is Suitable for investors who are seeking* | |
|
|
Scheme Riskometers |
Benchmark Riskometers |
 As per AMFI Tier I Benchmark i.e. Nifty 500 TRI
|
|
* Investors should consult their financial advisers if in doubt about whether the product is suitable for them. |
|