MAHINDRA MANULIFE MULTI CAP FUND
(Multi Cap Fund- An open ended equity scheme investing across large cap, mid cap, small cap stocks)
 |
 |
 |
 |
 |
| Data as on 31st, March 2024 |
||||
| Investment Objective | The investment objective of the Scheme is to provide medium to long term capital appreciation through appropriate diversification and taking low risk on business quality. The diversified portfolio would predominantly consist of equity and equity related securities including derivatives. However, there can be no assurance that the investment objective of the Scheme will be achieved. |
| Fund Features |
|
| Fund Manager and Experience | Fund Manager: Mr. Manish Lodha Total Experience: 23 years Experience in managing this fund: 3 years and 3 months (Managing since December 21, 2020) Fund Manager: Ms. Fatema Pacha Total Experience: 18 years Experience in managing this fund: 3 years and 5 months (managing since October 16, 2020) |
| Date of allotment | May 11, 2017 |
| Benchmark | Nifty 500 Multicap 50:25:25 TRI Index |
| Options | IDCW (IDCW Option will have IDCW Reinvestment (D) & IDCW Payout facility) and Growth (D) D-Default |
| Minimum Application Amount | Rs. 1,000 and in multiples of Re. 1/-
thereafter |
| Minimum Additional Purchase Amount: | Rs. 1,000 and in multiples of Re. 1/- thereafter |
| Minimum Redemption / Switch-outs: | Rs. 1,000/- or 100 units or account balance, whichever is lower |
| SIP | Minimum Weekly & Monthly SIP Amount: Rs 500 and in
multiples of Re 1 thereafter Minimum Weekly & Monthly SIP Installments: 6 Minimum Quarterly SIP Amount: Rs 1,500 and in multiples of Re 1 thereafter Minimum Quarterly SIP installments: 4 |
| Monthly AAUM as on March 31, 2024 (Rs. in Cr.): | 3,104.35 |
| Quarterly AAUM as on March 31, 2024 (Rs. in Cr.): | 2,976.74 |
| Monthly AUM as on March 31, 2024 (Rs. in Cr.): | 3,165.04 |
| Total Expense Ratio 1 as on March 31, 2024: |
Regular Plan: 1.88% Direct Plan: 0.39% 1Includes additional expenses charged in terms of Regulation 52 (6A) (b) and 52 (6A)(c) of SEBI (Mutual Funds) Regulations, 1996 and Goods and Services Tax. |
| Load Structure: | Entry Load: N.A. Exit Load: An Exit Load of 1% is payable if Units are redeemed / switched-out upto 3 months from the date of allotment; Nil if Units are redeemed / switched-out after 3 months from the date of allotment. |
| Portfolio Turnover Ratio (Last 1 year): | 1.13 |
| Standard Deviation: | 14.39% |
| Beta: | 0.97 |
| Sharpe Ratio#: | 1.07 |
| Jenson’s Alpha : | 0.1795 |
| #Risk-free rate assumed to be 7.90% (MIBOR as on 28-03-24) -
Source:www.mmda.org Note: As per AMFI guidelines for factsheet, the ratios are calculated based on month rolling returns for last 3 years. Data as on March 28, 2024 |
|
| NAV/Unit | Regular Plan (In Rs.) |
Direct Plan (In Rs.) |
| IDCW | 22.7202 |
26.6537 |
| Growth | 29.9259 |
34.0866 |
| IDCW: Income Distribution cum Capital Withdrawal | ||
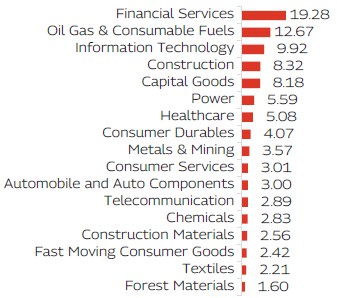
Issuer |
% of Net Assets |
||
|---|---|---|---|
| Automobile and Auto Components | 3.00% |
||
 |
Tata Motors Limited | 3.00% |
|
| Capital Goods | 8.18% |
||
| Titagarh Rail Systems Limited | 1.83% |
||
| Kaynes Technology India Limited | 1.74% |
||
| PTC Industries Limited | 1.34% |
||
| KEI Industries Limited | 1.25% |
||
| Hitachi Energy India Limited | 1.05% |
||
| Escorts Kubota Limited | 0.98% |
||
| Chemicals | 2.83% |
||
| Solar Industries India Limited | 1.67% |
||
| Gujarat State Fertilizers & Chemicals Limited | 1.15% |
||
| Construction | 8.32% |
||
|
Larsen & Toubro Limited | 2.74% |
|
| IRCON International Limited | 1.87% |
||
| Kalpataru Projects International Limited | 1.52% |
||
| Power Mech Projects Limited | 1.23% |
||
| Engineers India Limited | 0.96% |
||
| Construction Materials | 2.56% |
||
| ACC Limited | 1.77% |
||
| Orient Cement Limited | 0.79% |
||
| Consumer Durables | 4.07% |
||
| Dixon Technologies (India) Limited | 1.51% |
||
| Titan Company Limited | 1.18% |
||
| Safari Industries (India) Limited | 0.83% |
||
| Metro Brands Limited | 0.56% |
||
| Consumer Services | 3.01% |
||
| EIH Limited | 2.03% |
||
| Aditya Vision Ltd | 0.97% |
||
| Fast Moving Consumer Goods | 2.42% |
||
| Sula Vineyards Ltd | 1.50% |
||
| Balrampur Chini Mills Limited | 0.91% |
||
| Financial Services | 19.28% |
||
|
Canara Bank | 4.45% |
|
| State Bank of India | 2.02% |
||
| Kotak Mahindra Bank Limited | 1.45% |
||
| Bank of India | 1.39% |
||
| CRISIL Limited | 1.29% |
||
| HDFC Asset Management Company Limited | 1.19% |
||
| CreditAccess Grameen Limited | 1.11% |
||
| ICICI Bank Limited | 1.04% |
||
| PNB Housing Finance Limited | 0.98% |
||
| Punjab National Bank | 0.92% |
||
| The South Indian Bank Limited | 0.90% |
||
| Cholamandalam Financial Holdings Limited | 0.88% |
||
| Bandhan Bank Limited | 0.80% |
||
| Jio Financial Services Limited | 0.67% |
||
| ICICI Securities Limited | 0.19% |
||
| Forest Materials | 1.60% |
||
| Century Textiles & Industries Limited | 1.60% |
||
| Healthcare | 5.08% |
||
| Krishna Institute Of Medical Sciences Limited | 1.20% |
||
| Sun Pharmaceutical Industries Limited | 1.02% |
||
| Divi's Laboratories Limited | 1.00% |
||
| Dr. Reddy's Laboratories Limited | 0.93% |
||
| Gland Pharma Limited | 0.93% |
||
| Information Technology | 9.92% |
||
|
Tata Consultancy Services Limited | 3.99% |
|
| Wipro Limited | 1.87% |
||
| Tech Mahindra Limited | 1.44% |
||
| Persistent Systems Limited | 1.38% |
||
| LTIMindtree Limited | 1.23% |
||
| Metals & Mining | 3.57% |
||
| Steel Authority of India Limited | 1.91% |
||
| NMDC Limited | 1.66% |
||
| Oil Gas & Consumable Fuels | 12.67% |
||
|
Coal India Limited | 4.22% |
|
|
Reliance Industries Limited | 3.43% |
|
|
Hindustan Petroleum Corporation Limited | 3.41% |
|
| Oil India Limited | 1.61% |
||
| Power | 5.59% |
||
|
Tata Power Company Limited | 2.86% |
|
|
NTPC Limited | 2.73% |
|
| Telecommunication | 2.89% |
||
|
Bharti Airtel Limited | 2.89% |
|
| Textiles | 2.21% |
||
| K.P.R. Mill Limited | 1.56% |
||
| Nitin Spinners Limited | 0.65% |
||
| Equity and Equity Related Total | 97.20% |
||
| Cash & Other Receivables | 2.80% |
||
| Grand Total | 100.00% |
||
| ( Top Ten Holdings - Issuer wise) as on March 31, 2024) |
|||
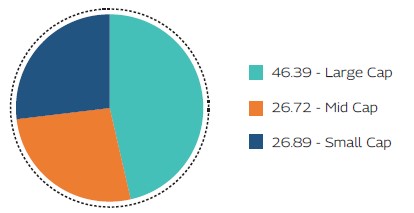
As per the latest Market Capitalisation data provided by AMFI (In line with the applicable SEBI guidelines)
Record Date
|
Plan(s) / Option(s)
|
IDCW |
Face Value |
Cum-IDCW NAV |
(Rs. per unit) |
(Rs. per unit) |
(Rs. per unit) |
||
17-Mar-22 |
Regular IDCW |
1.50 |
10 |
17.9233 |
17-Mar-22 |
Direct IDCW |
1.50 |
10 |
19.8577 |
27-Feb-23 |
Regular IDCW |
1.00 |
10 |
17.1815 |
27-Feb-23 |
Direct IDCW |
1.00 |
10 |
19.5379 |
14-Mar-24 |
Regular IDCW |
1.00 |
10 |
24.4659 |
14-Mar-24 |
Direct IDCW |
1.00 |
10 |
28.4955 |
Pursuant to payment of IDCW, the NAV of the IDCW Option(s) of the Scheme/Plan(s) falls to the extent of payout and statutory levy, if any. Past performance may or may not be sustained in future and should not be used as a basis for comparison with other investments. For complete list of IDCWs, visit www.mahindramanulife.com.
| Mahindra Manulife Multi Cap Fund | CAGR Returns (%) |
Value of Investment of Rs. 10,000* |
NAV / Index Value (as on March 28, 2024) |
||||||
| Managed by Mr. Manish Lodha & Ms. Fatema Pacha | 1 Year |
3 Years |
5 Years |
Since Inception |
1 Year |
3 Years |
5 Years |
Since Inception |
|
| Regular Plan - Growth Option | 49.17 |
24.78 |
22.57 |
17.26 |
14,885 |
19,404 |
27,651 |
29,926 |
29.9259 |
| Direct Plan - Growth Option | 51.49 |
26.95 |
24.69 |
19.50 |
15,115 |
20,431 |
30,121 |
34,087 |
34.0866 |
| Nifty 500 Multicap 50:25:25 TRI Index ^ | 47.88 |
22.32 |
19.39 |
15.49 |
14,756 |
18,282 |
24,246 |
26,950 |
17,809.16 |
| Nifty 50 Index TRI^^ | 30.27 |
16.35 |
15.29 |
14.75 |
13,008 |
15,736 |
20,356 |
25,790 |
32,867.23 |
^Benchmark ^^Additional Benchmark. CAGR – Compounded Annual Growth Rate. Inception/Allotment date: 11-May-17.
Past performance may or may not be sustained in future and should not be used as a basis of comparison with other investments. Since inception returns of the scheme is calculated on face value of Rs. 10 invested at inception. The performance details provided above are of Growth
Option under Regular and Direct Plan. Different Plans i.e Regular Plan and Direct Plan under the scheme has different expense structure. Mr. Manish Lodha is managing this fund since December 21, 2020. Ms. Fatema Pacha is managing this scheme since October 16, 2020. *Based on standard
investment of Rs. 10,000 made at the beginning of the relevant period. For performance details of other schemes managed by the Fund Manager(s), please click here | Best Viewed in Landscape mode
| Mahindra Manulife Multi Cap Fund | Regular Plan |
Direct Plan |
Nifty 500 Multicap 50:25:25 TRI Index^ |
Nifty 50 Index TRI^^ |
|||||
| SIP Investment Period | Total Amount Invested (  ) ) |
Market Value ( ) |
CAGR Returns (%) |
Market Value ( ) |
CAGR Returns (%) |
Market Value ( ) |
CAGR Returns (%) |
Market Value ( ) |
CAGR Returns (%) |
| 1 Year | 1,20,000 |
1,45,652 |
42.68 |
1,46,928 |
44.92 |
1,44,149 |
40.06 |
1,37,018 |
27.81 |
| 3 Years | 3,60,000 |
5,13,688 |
24.67 |
5,28,019 |
26.70 |
5,04,686 |
23.37 |
4,61,270 |
16.89 |
| 5 Years | 6,00,000 |
11,53,686 |
26.58 |
12,14,394 |
28.74 |
11,11,122 |
25.00 |
9,52,244 |
18.60 |
| Since Inception | 8,20,000 |
17,75,655 |
22.32 |
19,06,119 |
24.38 |
16,60,520 |
20.37 |
14,53,035 |
16.51 |
^Benchmark ^^Additional Benchmark. CAGR – Compounded Annual Growth Rate. Inception/Allotment date: 11-May-17. Past performance may or may not be sustained in future and should not be used as a basis of comparison with other investments. Returns greater than 1 year period are compounded annualized. For SIP returns, monthly investment of equal amounts invested on the 1st business day of every month has been considered. CAGR Returns (%) are computed after accounting for the cash flow by using the XIRR method (investment internal rate of return). For SIP Performance please click here | Best Viewed in Landscape mode
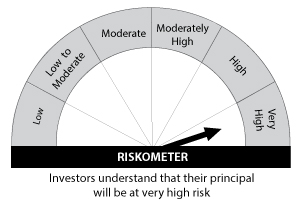
Product Suitability
|
|
| This Product is Suitable for investors who are seeking* | |
|
|
Scheme Riskometers |
Benchmark Riskometers |
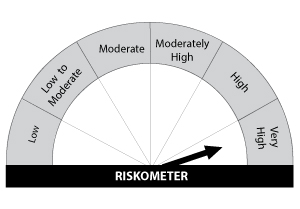 Scheme Benchmark: Nifty 500 Multicap 50:25:25 TRI Index
|
|
* Investors should consult their financial advisers if in doubt about whether the product is suitable for them. |
|