MAHINDRA MANULIFE EQUITY SAVINGS FUND
(An open ended scheme investing in equity, arbitrage and debt)
 |
 |
 |
 |
 |
| Data as on 31st, March 2024 | ||||
| Investment Objective | The Scheme seeks to generate long term capital appreciation and also income through investments in equity and equity related instruments, arbitrage opportunities and investments in debt and money market instruments. However, there can be no assurance that the investment objective of the Scheme will be achieved. The Scheme does not assure or guarantee any returns. |
| Fund Features |
Potential capital appreciation and wealth accumulation through regular investments in the long term. Balances the risk of equity with investments in debt and derivative securities. Flexible Asset Allocation feature in dynamic market scenarios. |
| Fund Manager and Experience | Fund Manager (Equity): Mr. Manish Lodha Total Experience: 23 years Experience in managing this fund: 3 years and 3 months (Managing since December 21, 2020) Fund Manager (Equity): Mr. Renjith Sivaram Total Experience: 13 years Experience in managing this fund: 9 months (managing since July 03, 2023) Fund Manager (Debt): Mr. Rahul Pal Total Experience: 22 years Experience in managing this fund: 7 years and 2 month (managing since February 1, 2017) Fund Manager (Hybrid): Mr. Pranav Patel$ Total Experience: 9 years, $Dedicated Fund Manager for Overseas Investments Experience in managing this fund: 3 months (Managing since January 05, 2024) |
| Date of allotment | February 1, 2017 |
| Benchmark | Nifty Equity Savings Index TRI |
| Options | IDCW (IDCW Option will have IDCW Reinvestment (D) & IDCW Payout facility) and Growth (D) D-Default |
| Minimum Application Amount | Rs. 1,000/- and in multiples of Re. 1/- thereafter |
| Minimum Additional Purchase Amount | Rs. 1,000/- and in multiples of Re. 1/- thereafter |
| Minimum Repurchase Amount | Rs. 1,000/- or 100 units or account balance, whichever is lower |
| SIP | Minimum Weekly & Monthly SIP Amount: Rs 500 and in multiples of Re 1 thereafter Minimum Weekly & Monthly SIP Installments: 6 Minimum Quarterly SIP Amount: Rs 1,500 and in multiples of Re 1 thereafter Minimum Quarterly SIP installments: 4 |
| Monthly AAUM as on March 31, 2024 (Rs. in Cr.): | 457.72 |
| Quarterly AAUM as on March 31, 2024 (Rs. in Cr.): | 449.06 |
| Monthly AUM as on March 31, 2024 (Rs. in Cr.): | 464.80 |
| Total Expense Ratio1 as on March 31, 2024 | Regular Plan: 2.42% Direct Plan: 0.77% 1 Includes additional expenses charged in terms of Regulation 52(6A)(b) and 52(6A)(c) of SEBI (Mutual Funds) Regulations, 1996 and Goods and Services Tax |
| Load Structure: | Entry Load: N.A. Exit Load: 10% of the units allotted shall be redeemed without any exit load, on or before completion of 15 calendar days from the date of allotment of Units. Any redemption in excess of the above limit shall be subject to the following exit load: • An exit load of 1% is payable if Units are redeemed / switched-out on or before completion of 15 calendar days from the date of allotment of Units; • Nil - If Units are redeemed / switched-out after completion of 15 calendar days from the date of allotment of Units. |
| Annualised Portfolio YTM*2^: | 7.41%3 |
| Macaulay Duration^: | 1.51 Year3 |
| Modified Duration^: | 1.443 |
| Residual Maturity^: | 1.79 Years3 |
| Portfolio Turnover Ratio (Last 1 year): | 4.03 |
| As on (Date) : | March 31, 2024 |
| Standard Deviation: | 6.06% |
| Beta: | 1.16 |
| Sharpe Ratio#: | 0.35 |
| Jenson’s Alpha : | 0.0458 |
| *In case of semi annual YTM, it will be annualised ^For debt component #Risk-free rate assumed to be 7.90% (MIBOR as on 28-03-24) Source: www.mmda.org 2Yield to maturity should not be construed as minimum return offered by the Scheme. 3Calculated on amount invested in debt securities (including accrued interest), deployment of funds in TREPS and Reverse Repo and net receivable / payable. $Dedicated Fund Manager for Overseas Investments, Note: As per AMFI guidelines for factsheet, the ratios are calculated based on month rolling returns for last 3 years. Data as on March 28, 2024 |
|
| NAV/Unit | Regular Plan (In Rs.) |
Direct Plan (In Rs.) |
| IDCW | 13.3287 |
15.7690 |
| Growth | 18.6701 |
21.3230 |
| IDCW: Income Distribution cum Capital Withdrawal. $Dedicated Fund Manager for Overseas Investments | ||
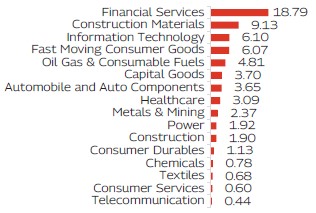
Company / Issuer |
Rating |
% of Net Assets$ |
% to NAV Derivatives |
|
|---|---|---|---|---|
| Automobile and Auto Components | 3.65% |
-0.53% |
||
| Tata Motors Limited | 0.93% |
|||
| LG Balakrishnan & Bros Limited | 0.90% |
|||
| Asahi India Glass Limited | 0.72% |
|||
| Bharat Forge Limited | 0.58% |
|||
| Mahindra & Mahindra Limited | 0.52% |
-0.53% |
||
| Capital Goods | 3.70% |
|||
| Sanghvi Movers Limited | 0.70% |
|||
| AIA Engineering Limited | 0.58% |
|||
| Inox India Limited | 0.57% |
|||
| Syrma SGS Technology Limited | 0.50% |
|||
| TD Power Systems Limited | 0.49% |
|||
| KEI Industries Limited | 0.46% |
|||
| Escorts Kubota Limited | 0.39% |
|||
| Chemicals | 0.78% |
|||
| Archean Chemical Industries Limited | 0.42% |
|||
| PI Industries Limited | 0.36% |
|||
| Construction | 1.90% |
|||
| Larsen & Toubro Limited | 1.90% |
|||
| Construction Materials | 9.13% |
-7.15% |
||
 |
Ambuja Cements Limited | 7.11% |
-7.15% |
|
| Grasim Industries Limited | 1.01% |
|||
| Shree Cement Limited | 1.01% |
|||
| Consumer Durables | 1.13% |
|||
| Havells India Limited | 0.72% |
|||
| Voltas Limited | 0.41% |
|||
| Consumer Services | 0.60% |
|||
| Aditya Vision Ltd | 0.60% |
|||
| Fast Moving Consumer Goods | 6.07% |
-3.63% |
||
|
ITC Limited | 2.76% |
-2.41% |
|
| Hindustan Unilever Limited | 1.21% |
-1.22% |
||
| Tata Consumer Products Limited | 1.06% |
|||
| Dabur India Limited | 0.62% |
|||
| Triveni Engineering & Industries Limited | 0.42% |
|||
| Financial Services | 18.79% |
-10.27% |
||
|
Bajaj Finance Limited | 3.35% |
-3.37% |
|
|
ICICI Bank Limited | 3.00% |
-3.02% |
|
|
HDFC Bank Limited | 2.95% |
-0.67% |
|
| IndusInd Bank Limited | 2.01% |
-0.47% |
||
| Canara Bank | 1.89% |
-1.91% |
||
| Kotak Mahindra Bank Limited | 1.52% |
-0.84% |
||
| L&T Finance Holdings Limited | 0.77% |
|||
| SBI Life Insurance Company Limited | 0.76% |
|||
| REC Limited | 0.71% |
|||
| State Bank of India | 0.55% |
|||
| ICICI Securities Limited | 0.50% |
|||
| Jio Financial Services Limited | 0.41% |
|||
| RBL Bank Limited | 0.35% |
|||
| Healthcare | 3.09% |
-1.25% |
||
|
Sun Pharmaceutical Industries Limited | 2.35% |
-1.25% |
|
| Divi's Laboratories Limited | 0.74% |
|||
| Information Technology | 6.10% |
-2.01% |
||
|
Tech Mahindra Limited | 2.28% |
-1.10% |
|
| Infosys Limited | 1.41% |
-0.43% |
||
| LTIMindtree Limited | 1.00% |
-0.48% |
||
| Persistent Systems Limited | 0.60% |
|||
| Birlasoft Limited | 0.44% |
|||
| Wipro Limited | 0.37% |
|||
| Metals & Mining | 2.37% |
-1.69% |
||
| Jindal Steel & Power Limited | 1.28% |
-1.28% |
||
| Hindalco Industries Limited | 0.62% |
-0.41% |
||
| Tata Steel Limited | 0.47% |
|||
| Oil Gas & Consumable Fuels | 4.81% |
|||
|
Reliance Industries Limited | 2.75% |
||
| Coal India Limited | 1.09% |
|||
| GAIL (India) Limited | 0.97% |
|||
| Power | 1.92% |
|||
| NTPC Limited | 1.52% |
|||
| CESC Limited | 0.40% |
|||
| Telecommunication | 0.44% |
|||
| Indus Towers Limited | 0.44% |
|||
| Textiles | 0.68% |
|||
| Nitin Spinners Limited | 0.68% |
|||
| Equity and Equity Related Total | 65.16% |
-26.54% |
||
| Real Estate Investment Trusts (REIT) | 2.01% |
|||
| Brookfield India Real Estate Trust | Realty |
2.01% |
||
| Corporate Bond | 12.27% |
|||
|
Kotak Mahindra Investments Limited | CRISIL AAA |
2.16% |
|
| Small Industries Dev Bank of India | ICRA AAA |
2.14% |
||
| National Bank For Agriculture and Rural Development | CRISIL AAA |
1.64% |
||
| Bharti Telecom Limited | CRISIL AA+ |
1.08% |
||
| Kotak Mahindra Prime Limited | CRISIL AAA |
1.08% |
||
| Shriram Finance Limited | CRISIL AA+ |
1.08% |
||
| Mindspace Business Parks REIT | CRISIL AAA |
1.07% |
||
| Embassy Office Parks REIT | CRISIL AAA |
1.07% |
||
| TVS Credit Services Limited | CRISIL AA |
0.53% |
||
| Power Finance Corporation Limited | CRISIL AAA |
0.43% |
||
| Government Bond | 3.80% |
|||
| 7.18% GOI (MD 14/08/2033) | SOV |
1.95% |
||
| 7.32% GOI (MD 13/11/2030) | SOV |
1.09% |
||
| 6.99% GOI (MD 17/04/2026) | SOV |
0.54% |
||
| 7.37% GOI (MD 23/10/2028) | SOV |
0.22% |
||
| Treasury Bill | 10.22% |
|||
|
364 Days Tbill (MD 17/10/2024) | SOV |
2.90% |
|
| 182 Days Tbill (MD 04/04/2024) | SOV |
2.15% |
||
| 364 Days Tbill (MD 19/09/2024) | SOV |
2.08% |
||
| 364 Days Tbill (MD 14/11/2024) | SOV |
2.06% |
||
| 364 Days Tbill (MD 26/12/2024) | SOV |
1.02% |
||
| Cash & Net Receivables/(Payables) | 6.53% |
|||
| Grand Total | 100.00% |
|||
| ( Top Ten Holdings - Issuer wise) as on March 31, 2024) $Hedged and Unhedged postions |
||||
| Mahindra Manulife Equity Savings Fund | CAGR Returns (%) |
Value of Investment of Rs. 10,000* |
NAV / Index Value (as on March 28, 2024) |
||||||
| Managed by Mr. Manish Lodha , Mr. Renjith Sivaram (Equity); Mr. Rahul Pal (Debt) & Mr. Pranav Patel£ |
1 Year
|
3 Years |
5 Years |
Since Inception |
1 Year |
3 Years |
5 Years |
Since Inception |
|
| Regular Plan - Growth Option | 19.43 |
10.33 |
10.82 |
9.12 |
11,932 |
13,423 |
16,709 |
18,670 |
18.6701 |
| Direct Plan - Growth Option | 21.43 |
12.31 |
12.74 |
11.16 |
12,131 |
14,157 |
18,205 |
21,323 |
21.3230 |
| Nifty Equity Savings Index^ | 15.49 |
9.53 |
9.66 |
9.60 |
11,540 |
13,134 |
15,856 |
19,273 |
5,605.89 |
| CRISIL 10 Yr Gilt Index^^ | 8.55 |
4.30 |
6.15 |
5.06 |
10,850 |
11,343 |
13,474 |
14,240 |
4,555.88 |
^Benchmark ^^Additional Benchmark. CAGR – Compounded Annual Growth Rate. Inception/Allotment date: 1-Feb-17.
Past performance may or may not be sustained in future and should not be used as a basis of comparison with other investments. Since inception returns of the scheme is calculated on face value of Rs. 10 invested at inception. The performance details provided above are of Growth Option under Regular and Direct Plan. Different Plans i.e Regular Plan and Direct Plan under the scheme has different expense structure. *Based on standard investment of Rs. 10,000 made at the beginning of the relevant period. Ms. Fatema Pacha is managing this fund since October 16, 2020. Mr. Manish Lodha is managing this fund since December 21, 2020. Mr. Renjith Sivaram is managing this fund since July 03, 2023. Mr. Pranav Patel is managing this fund since January 05, 2024. £Dedicated Fund Manager for Overseas Investments.For performance details of other schemes managed by the Fund Manager(s). please click here | Best Viewed in Landscape mode
| Mahindra Manulife Equity Savings Fund Yojana |
Regular Plan |
Direct Plan |
Nifty Equity Savings Index TRI^ |
CRISIL 10 Yr Gilt Index^^ |
|||||
| SIP Investment Period | Total Amount Invested (  ) ) |
Market Value ( ) |
CAGR Returns (%) |
Market Value ( ) |
CAGR Returns (%) |
Market Value ( ) |
CAGR Returns (%) |
Market Value ( ) |
CAGR Returns (%) |
| 1 Year | 1,20,000 |
1,30,788 |
17.39 |
1,31,980 |
19.36 |
1,29,156 |
14.70 |
1,25,315 |
8.46 |
| 3 Years | 3,60,000 |
4,23,516 |
10.91 |
4,35,474 |
12.84 |
4,19,404 |
10.24 |
3,94,261 |
6.03 |
| 5 Years | 6,00,000 |
8,07,473 |
11.87 |
8,47,453 |
13.83 |
7,80,974 |
10.52 |
6,83,054 |
5.15 |
| Since Inception | 8,50,000 |
12,39,440 |
10.49 |
13,28,861 |
12.42 |
12,15,492 |
9.95 |
10,39,486 |
5.61 |
^Benchmark ^^Additional Benchmark. CAGR – Compounded Annual Growth Rate. Inception/Allotment date: 1-Feb-17. Past performance may or may not be sustained in future and should not be used as a basis of comparison with other investments. Returns greater than 1 year period are compounded annualized. For SIP returns, monthly investment of equal amounts invested on the 1st business day of every month has been considered. CAGR Returns (%) are computed after accounting for the cash flow by using the XIRR method (investment internal rate of return). For SIP Performance please click here | Best Viewed in Landscape mode
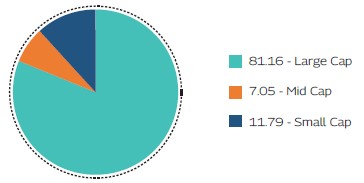
As per the latest Market Capitalisation data provided by AMFI (In line with the applicable SEBI guidelines)
Record Date |
Plan(s) / Option(s) |
IDCW |
Face Value |
Cum-IDCW NAV |
(Rs. per unit) |
(Rs. per unit) |
(Rs. per unit) |
||
17-Mar-22 |
Regular IDCW |
0.80 |
10 |
13.4499 |
17-Mar-22 |
Direct IDCW |
0.80 |
10 |
14.9344 |
27-Feb-23 |
Regular IDCW |
1.00 |
10 |
13.1514 |
27-Feb-23 |
Direct IDCW |
1.00 |
10 |
14.9588 |
14-Mar-24 |
Regular IDCW |
1.00 |
10 |
14.3968 |
14-Mar-24 |
Direct IDCW |
1.00 |
10 |
16.8312 |
Pursuant to payment of IDCW, the NAV of the IDCW Option(s) of the Scheme/Plan(s) falls to the extent of payout and statutory levy, if any. Past performance may or
may not be sustained in future and should not be used as a basis for comparison with other investments. For complete list of IDCWs, visit www.mahindramanulife.com. |
||||
Product Suitability
|
|
| This Product is Suitable for investors who are seeking* | |
|
|
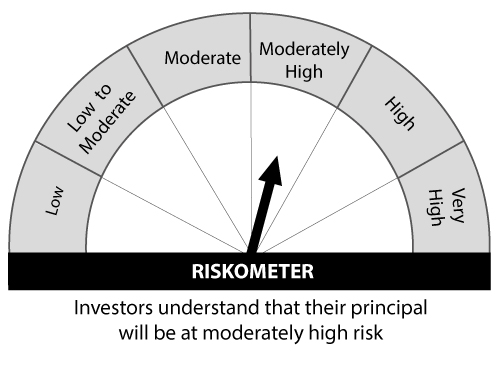
Scheme Riskometers |
Benchmark Riskometers |
|
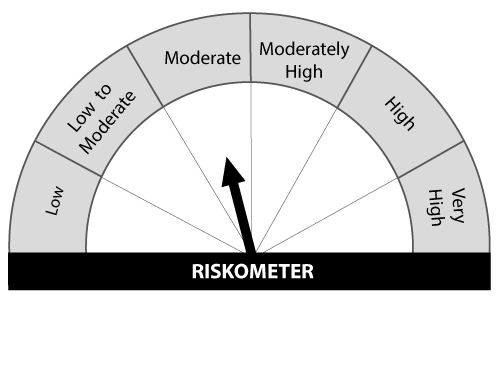 Scheme Benchmark: Nifty Equity Savings Index TRI |
* Investors should consult their financial advisers if in doubt about whether the product is suitable for them. |
|