MAHINDRA MANULIFE BALANCED ADVANTAGE FUND
(An open ended dynamic asset allocation fund)
 |
 |
 |
 |
 |
| Data as on 31st October 2025 | ||||
| Investment Objective | The investment objective of the Scheme is to provide capital appreciation and generate income through a dynamic mix of equity, debt and money market instruments. The Scheme seeks to reduce the volatility by diversifying the assets across equity, debt and money market instruments. However, there can be no assurance that the investment objective of the Scheme will be achieved. |
| Fund Features |
Optimal asset allocation at regular intervals. Aims to capture the optimum mix between Equity and Debt across market cycles. With flexibility to invest upto 100% in equity & debt, the Scheme may be suitable for volatile market conditions. Endeavours to provide tax efficiency* *Though the scheme is a dynamic asset allocation scheme, the endeavour will be to invest a minimum of 65% of its net assets in equity and equity related instruments which may help in attracting equity taxation as per prevailing tax laws. |
| Fund Manager and Experience | Fund Manager (Equity): Mr. Manish Lodha Total Experience: 23 years Experience in managing this fund: 3 Years and 10 months (Managing since December 30, 2021) Fund Manager (Equity): Ms. Fatema Pacha Total Experience: 18 years Experience in managing this fund: 3 Years and 10 months (managing since December 30, 2021) Fund Manager (Debt): Mr. Rahul Pal Total Experience: 22 years Experience in managing this fund: 3 Years and 10 months (Managing since December 30, 2021) |
| Date of allotment | December 30, 2021 |
| Benchmark | Nifty 50 Hybrid Composite Debt 50: 50 Index TRI |
| Options | Option: IDCW and Growth (D) D - Default |
| IDCW Sub-options: | IDCW Reinvestment (D) & IDCW Payout |
| Minimum Application Amount | Rs. 1,000/- and in multiples of Re.1/- thereafter |
| Minimum Additional Purchase Amount: | Rs. 1,000/- and in multiples of Re. 1/- thereafter |
| Minimum Redemption/Switch-Out Amount: | Rs. 1,000/- or 100 units or account balance, whichever is lower |
| SIP | Minimum Weekly & Monthly SIP Amount: Rs 500 and in multiples of Re 1 thereafter Minimum Weekly & Monthly SIP Installments: 6 |
| Monthly AAUM as on October 31, 2025 (Rs. in Cr.): | 931.34 |
| Monthly AUM as on October 31, 2025 (Rs. in Cr.): | 940.44 |
| Total Expense Ratio1 as on October 31, 2025: | Regular Plan: 2.19% Direct Plan: 0.53% 1Includes additional expenses charged in terms of Regulation 52(6A)(b) and 52(6A)(c) of SEBI (Mutual Funds) Regulations, 1996 and Goods and Services Tax. |
| Load Structure: | Entry Load: N.A. Exit Load: 10% of the units allotted shall be redeemed without any exit load, on or before completion of 3 months from the date of allotment of Units. Any redemption in excess of the above limit shall be subject to the following exit load: ● An Exit Load of 1% is payable if Units are redeemed / switched-out on or before completion of 3 months from the date of allotment of Units; ● Nil - If Units are redeemed / switched-out after completion of 3 months from the date of allotment of Units. |
| Annualised Portfolio YTM*2^: | 6.47%3 |
| Macaulay Duration^: | 2.44 years3 |
| Modified Duration^: | 2.33 years3 |
| Residual Maturity^: | 3.60 years3 |
| Portfolio Turnover Ratio (Last 1 year): | 2.19 |
| As on (Date) | October 31, 2025 |
| Standard Deviation | 8.49% |
| Beta | 1.13 |
| Sharpe Ratio# | 0.79 |
| Jenson's Alpha | 0.0771 |
| ^For debt component *In case of semi annual YTM, it will be annualised 2Yield to maturity should not be construed as minimum return offered by the scheme; #Risk-free rate assumed to be 5.69% (MIBOR as on 31-10-2025) Source: www.mmda.org Note: As per AMFI guidelines for factsheet, the ratios are calculated based on month rolling returns for last 3 years. Data as on October 31, 2025 3Calculated on amount invested in debt securities (including accrued interest), deployment of funds in TREPS and Reverse Repo and net receivable / payable. |
|
| NAV/Unit | Regular Plan (In Rs.) |
Direct Plan (In Rs.) |
| IDCW | 12.4452 |
13.4383 |
| Growth | 14.7236 |
15.7605 |
| IDCW: Income Distribution cum Capital Withdrawal. |
||
| Company / Issuer | Rating | % of Net Assets | % to NAV Derivatives | |
|---|---|---|---|---|
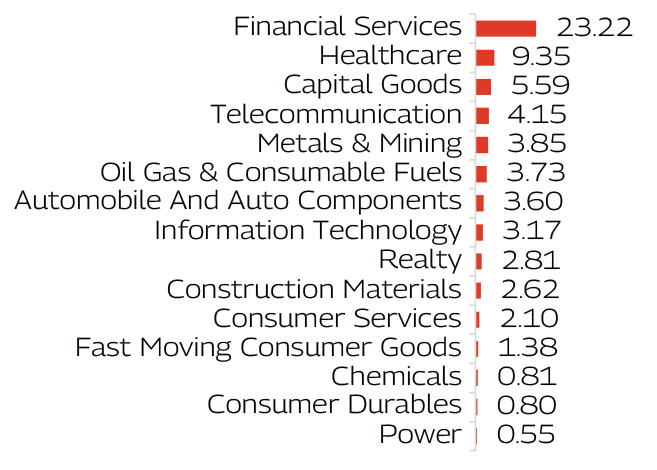
| Automobile And Auto Components | 3.60 | |||
| Maruti Suzuki India Limited | 1.17 | |||
| Mahindra & Mahindra Limited | 0.96 | |||
| Bajaj Auto Limited | 0.76 | |||
| Bosch Limited | 0.71 | |||
| Tata Motors Passenger Vehicles Ltd. | 0.00 | |||
| Capital Goods | 5.59 | |||
| Kaynes Technology India Limited | 1.54 | |||
| Bharat Electronics Limited | 1.08 | |||
| Bharat Heavy Electricals Limited | 0.99 | |||
| Tega Industries Limited | 0.91 | |||
| Hindustan Aeronautics Limited | 0.40 | |||
| Polycab India Limited | 0.37 | |||
| Oswal Pumps Limited | 0.30 | |||
| TML Commercial Vehicles Ltd | 0.00 | |||
| ABB India Limited | 0.00 | |||
| Chemicals | 0.81 | |||
| SRF Limited | 0.81 | |||
| Construction Materials | 2.62 | |||
 | UltraTech Cement Limited | 2.62 | ||
| Consumer Durables | 0.80 | |||
| Kajaria Ceramics Limited | 0.80 | |||
| Consumer Services | 2.10 | |||
| Aditya Vision Ltd | 1.21 | |||
| Vishal Mega Mart Limited | 0.62 | |||
| Arvind Fashions Limited | 0.27 | |||
| Fast Moving Consumer Goods | 1.38 | |||
| Dabur India Limited | 0.88 | |||
| AWL Agri Business Limited | 0.50 | |||
| Financial Services | -2.13 | -2.13 | ||
| ICICI Bank Limited | 2.43 | ||
| State Bank of India | 2.14 | ||
| Axis Bank Limited | 1.97 | ||
| IndusInd Bank Limited | 1.74 | ||
| HDFC Bank Limited | 1.54 | |||
| Bajaj Finserv Limited | 1.38 | |||
| Bajaj Finance Limited | 1.30 | -1.26 | ||
| The Federal Bank Limited | 1.17 | |||
| Angel One Limited | 1.12 | |||
| IDFC First Bank Limited | 1.09 | |||
| Indian Bank | 0.96 | |||
| Canara Bank | 0.92 | |||
| RBL Bank Limited | 0.90 | |||
| REC Limited | 0.86 | -0.87 | ||
| HDFC Asset Management Company Ltd. | 0.77 | |||
| Cholamandalam Financial Holdings Ltd. | 0.66 | |||
| Aditya Birla Sun Life AMC Limited | 0.65 | |||
| CRISIL Limited | 0.56 | |||
| ICICI Lombard General Insurance Company Limited | 0.55 | |||
| IIFL Finance Limited | 0.51 | |||
| Healthcare | 9.35 | |||
| Divi's Laboratories Limited | 1.79 | ||
| Glenmark Pharmaceuticals Limited | 1.61 | |||
| Laurus Labs Limited | 1.54 | |||
| Apollo Hospitals Enterprise Limited | 1.51 | |||
| Fortis Healthcare Limited | 1.41 | |||
| Senores Pharmaceuticals Limited | 0.88 | |||
| Mankind Pharma Limited | 0.61 | |||
| Information Technology | 3.17 | |||
| Infosys Limited | 1.26 | |||
| Oracle Financial Services Software Ltd. | 0.72 | |||
| Wipro Limited | 0.67 | |||
| LTIMindtree Limited | 0.52 | |||
| Metals & Mining | 3.85 | |||
| JSW Steel Limited | 3.85 | ||
| Oil Gas & Consumable Fuels | 3.73 | |||
| Reliance Industries Limited | 1.90 | ||
| Coal India Limited | 1.07 | |||
| Mahanagar Gas Limited | 0.76 | |||
| Power | 0.55 | |||
| JSW Energy Limited | 0.55 | |||
| Realty | 2.81 | |||
| DLF Limited | 1.37 | |||
| Godrej Properties Limited | 0.85 | |||
| Sri Lotus Developers and Realty Ltd. | 0.59 | |||
| Telecommunication | 4.15 | |||
| Indus Towers Limited | 2.40 | ||
| Bharti Airtel Limited | 1.75 | ||
| Equity and Equity Related Total | 67.73 | -2.13 | ||
| Corporate Bond | 13.95 | |||
| National Bank For Agriculture and Rural Development | ICRA AAA/CRISIL AA+ | 5.42 | ||
| Muthoot Finance Limited | CRISIL AA+ | 2.69 | ||
| Small Industries Dev Bank of India | CRISIL AAA | 2.16 | ||
| Bharti Telecom Limited | CRISIL AAA | 1.10 | ||
| Power Finance Corporation Ltd. | CRISIL AAA | 0.96 | ||
| TVS Credit Services Limited | CRISIL AA+ | 0.54 | ||
| LIC Housing Finance Limited | CRISIL AAA | 0.54 | ||
| Embassy Office Parks REIT | CRISIL AAA | 0.54 | ||
| Certificate of Deposit | 1.03 | |||
| Indian Bank | CRISIL A1+ | 1.03 | ||
| Commercial Paper | 3.18 | |||
| Nirma Limited | CRISIL A1+ | 2.65 | ||
| SBI Cards and Payment Services Limited | CRISIL A1+ | 0.53 | ||
| Government Bond | 5.14 | |||
| 6.68% GOI (MD 07/07/2040) | SOV | 2.14 | ||
| 6.33% GOI (MD 05/05/2035) | SOV | 2.04 | ||
| 7.24% GOI (MD 18/08/2055) | SOV | 0.96 | ||
| Treasury Bill | 1.06 | |||
| 364 Days Tbill (MD 06/11/2025) | SOV | 1.06 | ||
| Cash & Other Receivables | 7.91 | |||
| Grand Total | 100.00 |
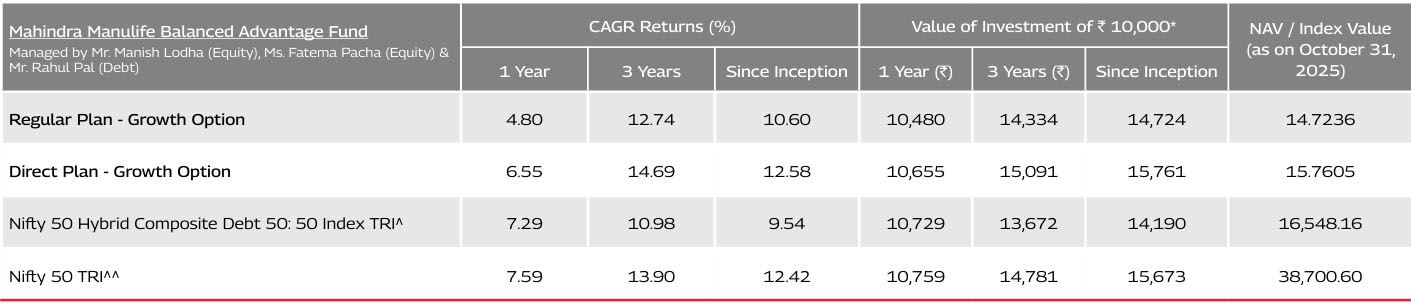
^Benchmark ^^Additional Benchmark. Inception/Allotment date: 30-Dec-21. CAGR - Compounded Annual Growth Rate. Past performance may or may not be sustained in future and should not be used as a basis of comparison with other investments. Since inception returns of the scheme is calculated on face value of Rs. 10 invested at inception. The performance details provided above are of Growth Option under Regular and Direct Plan. Different Plans i.e Regular Plan and Direct Plan under the scheme has different expense structure. *Based on standard investment of Rs. 10,000 made at the beginning of the relevant period. For performance details of other schemes managed by the Fund Manager(s), please click here | Best Viewed in Landscape mode
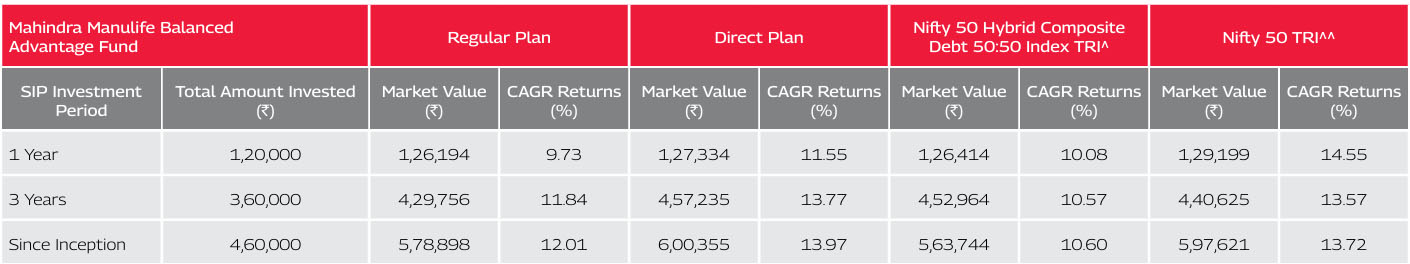
^Benchmark ^^Additional Benchmark. CAGR – Compounded Annual Growth Rate. Inception/Allotment date: 30-December-21. Past performance may or may not be sustained in future and should not be used as a basis of comparison with other investments. Returns greater than 1 year period are compounded annualized. For SIP returns, monthly investment of equal amounts invested on the 1st business day of every month has been considered. CAGR Returns (%) are computed after accounting for the cash flow by using the XIRR method (investment internal rate of return). For SIP Performance please click here | Best Viewed in Landscape mode
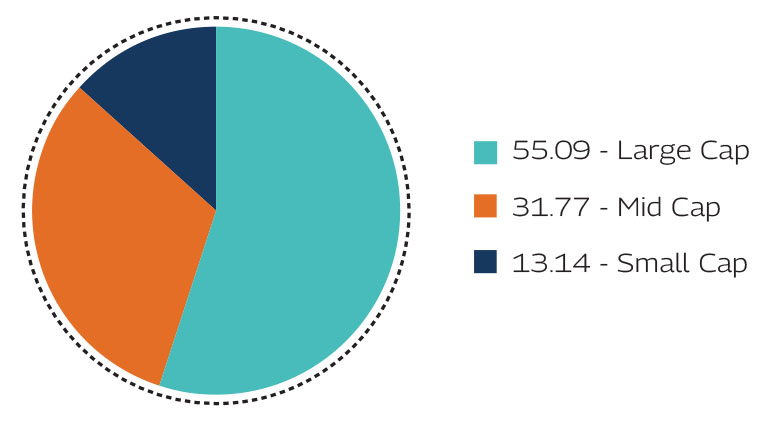
As per the latest Market Capitalisation data provided by AMFI (In line with the applicable SEBI guidelines)
Record Date |
Plan(s) / Option(s) |
IDCW |
Face Value |
Cum-IDCW NAV |
(Rs. per unit) |
(Rs. per unit) |
(Rs. per unit) |
||
14-Mar-24 |
Regular IDCW |
1.00 |
10 |
13.1323 |
14-Mar-24 |
Direct IDCW |
1.00 |
10 |
13.6732 |
13-Mar-25 |
Regular IDCW |
1.00 |
10 |
12.1327 |
13-Mar-25 |
Direct IDCW |
1.00 |
10 |
12.8910 |
Pursuant to payment of IDCW, the NAV of the IDCW Option(s) of the Scheme/Plan(s) falls to the extent of payout and statutory levy, if any. Past performance may or may not be sustained in future and should not be used as a basis for comparison with other investments. For complete list of IDCWs, visit www.mahindramanulife.com. |
Product Suitability |
|
| This Product is Suitable for investors who are seeking* | |
|
|
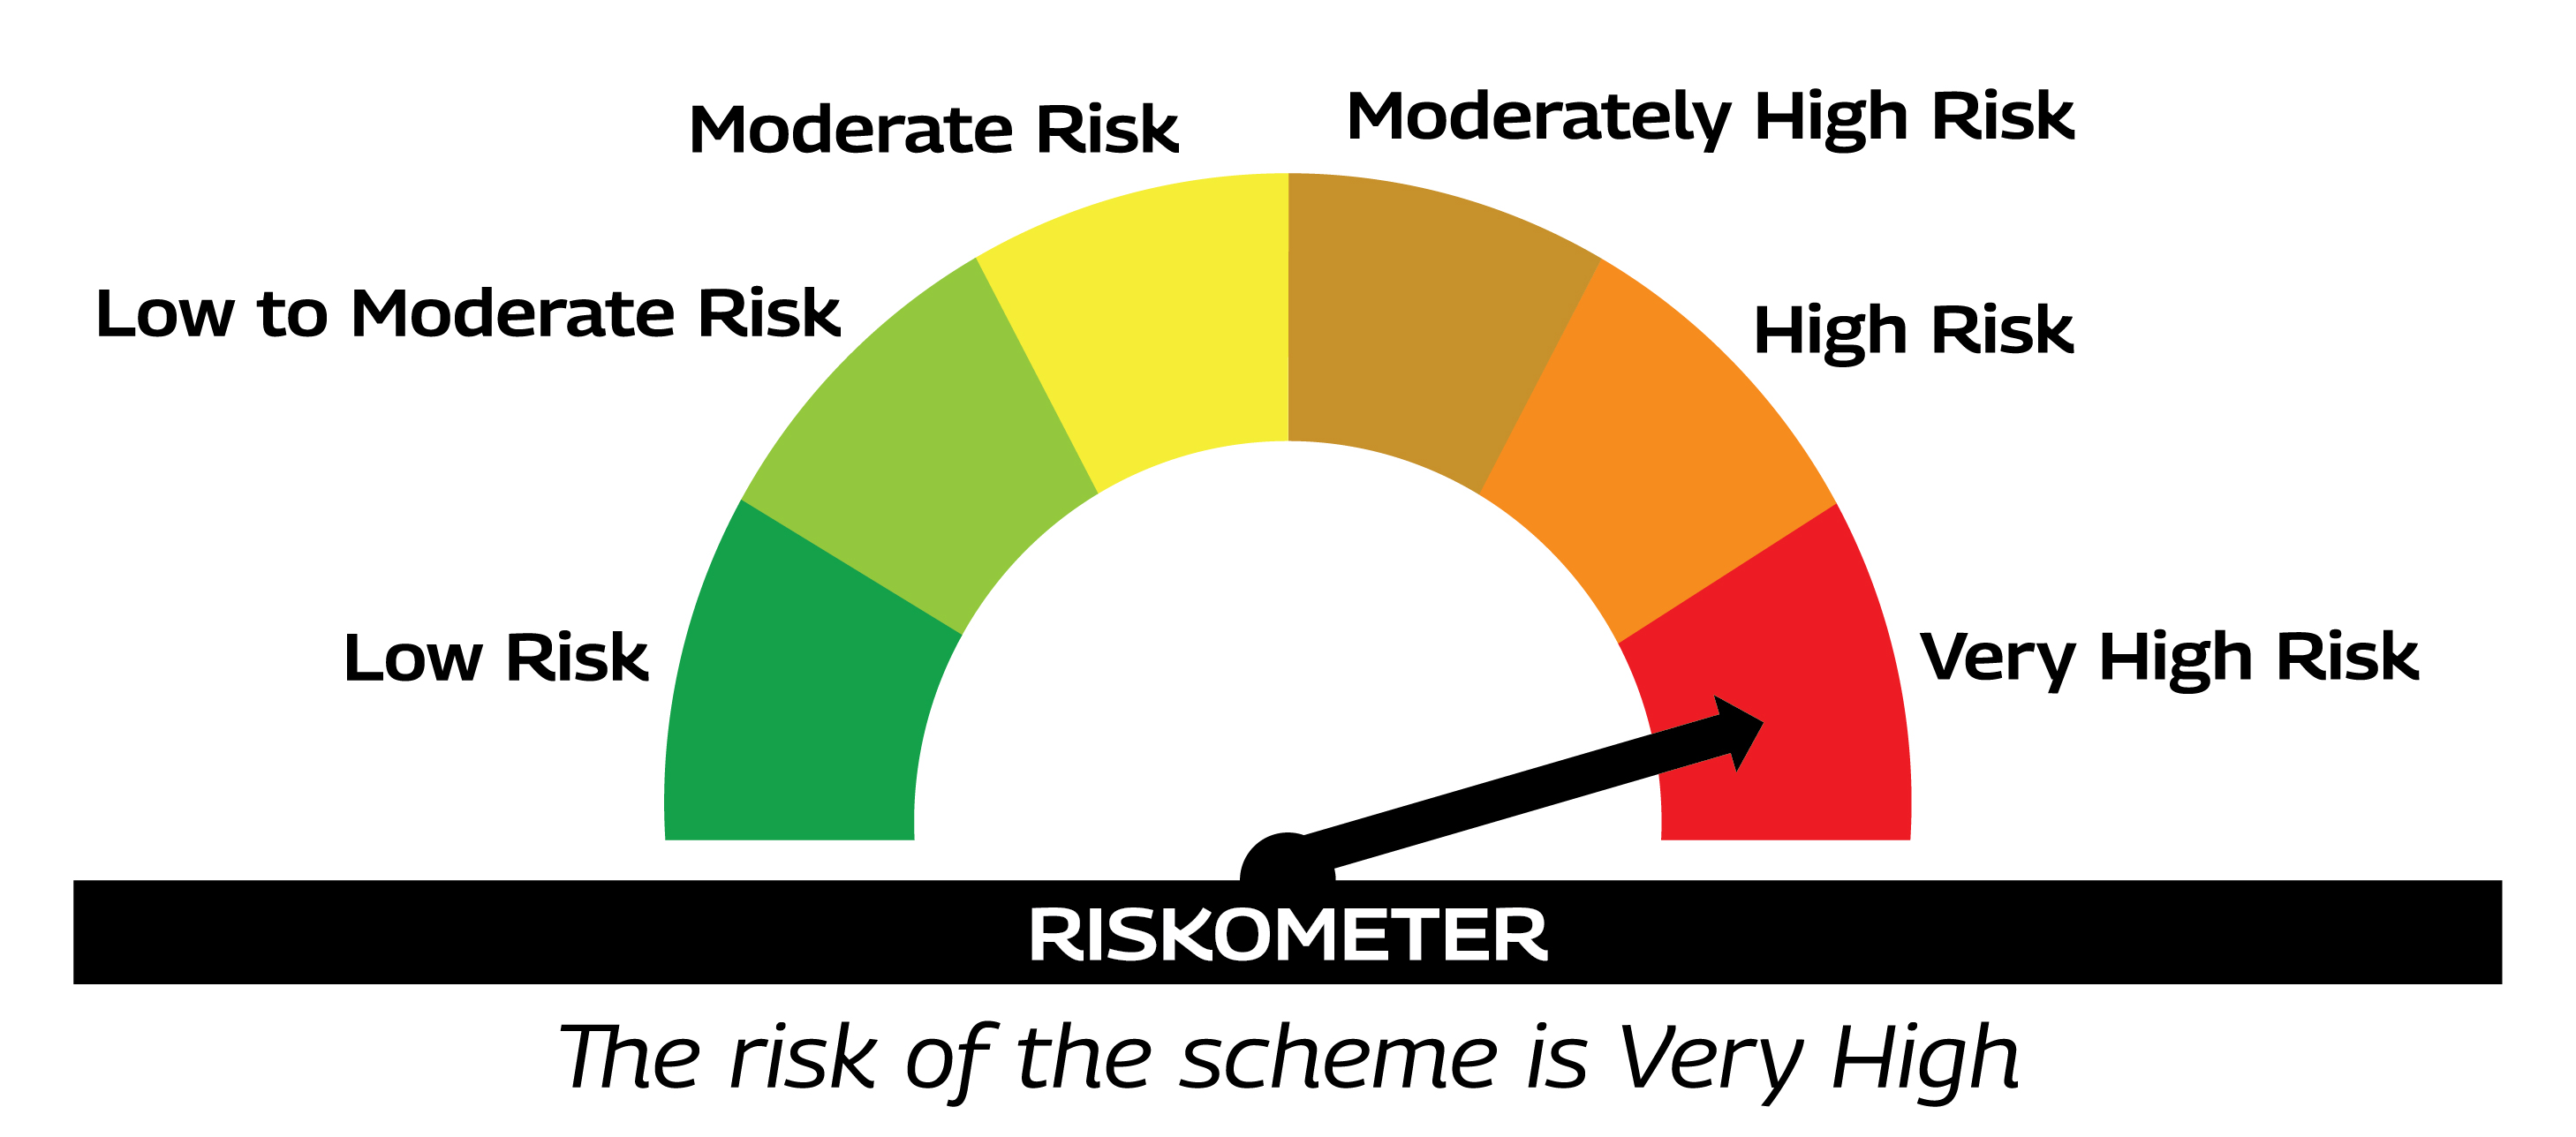
Scheme Riskometers |
Benchmark Riskometers |
 |
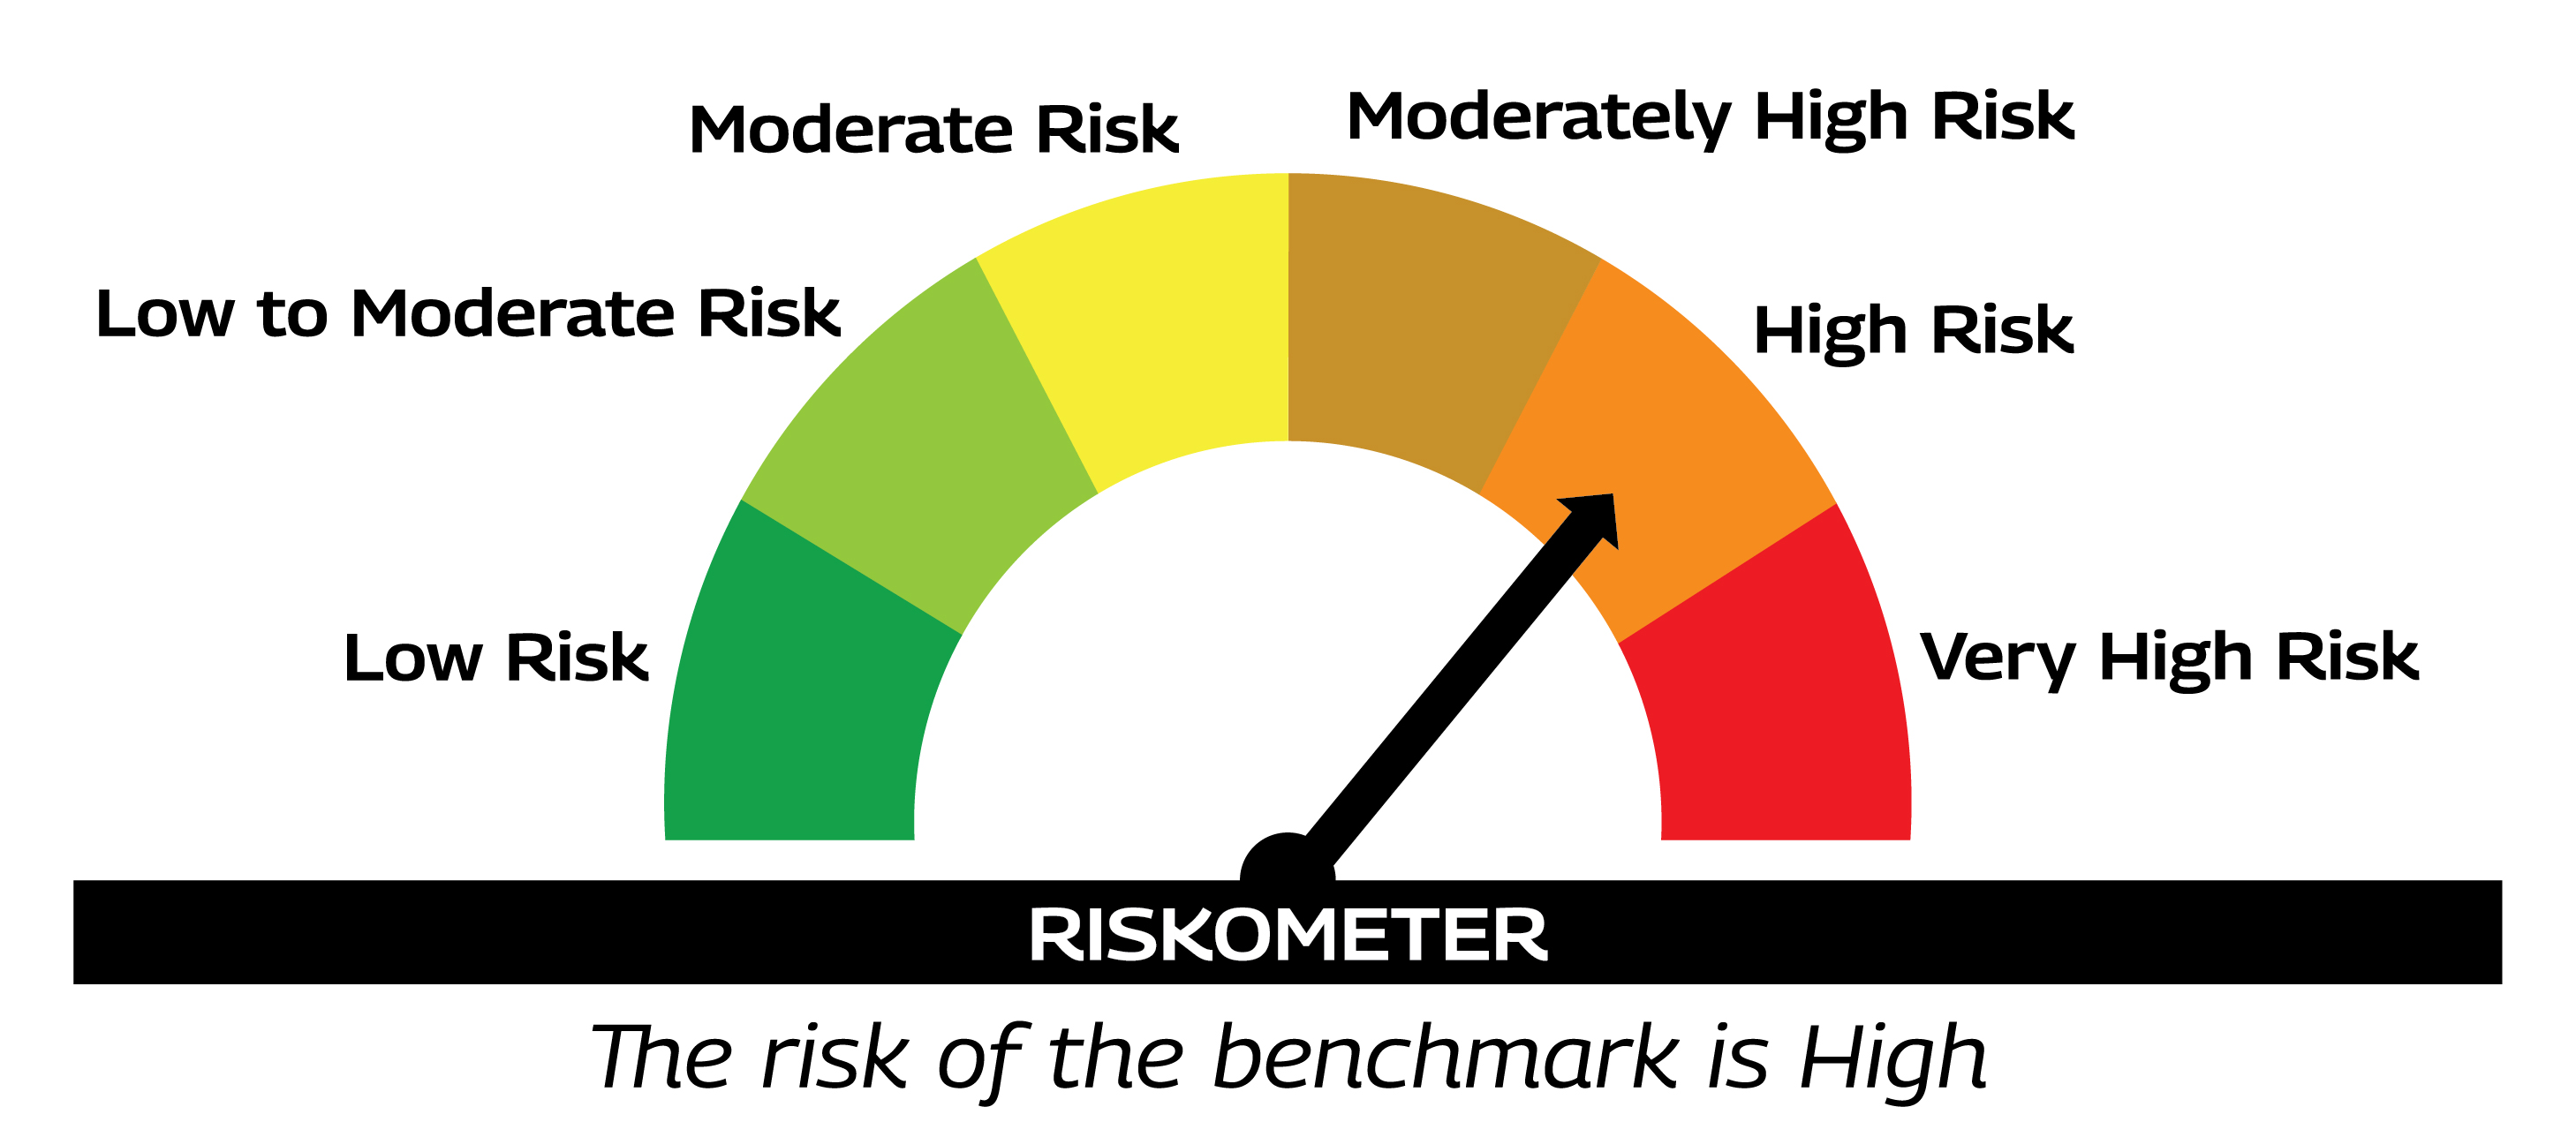 As per AMFI Tier I Benchmark i.e. Nifty 50 Hybrid Composite Debt 50: 50 Index TRI |
* Investors should consult their financial advisers if in doubt about whether the product is suitable for them. |
|