Mahindra Manulife Equity Savings Fund
(An open ended scheme investing in equity, arbitrage and debt)


|

|

|

|
One Pager as on March 31, 2024
 | Potential capital appreciation & wealth accumulation through regular investments in long term |
 | Balances the risk of equity with investments in debt and derivative securities |
 | Flexible asset allocation feature in dynamic market scenarios |
- A well-diversified portfolio that balances risk in equity through investments in
debt and arbitrage
- The equity strategy will be guided by sector and market outlook for medium to
long term
- The debt strategy will be guided by interest rate movements and change in term
structure and credit spreads
- A portfolio structured to reduce the impact of market volatility or drawdowns
making it an all season investment option
- Key Overweight sectors/Industries include Capital Goods, Construction Materials
and Power vs the Scheme’s Benchmark
- Key Underweight sectors /Industries include Banks, IT and Telecom vs the
Scheme’s Benchmark.
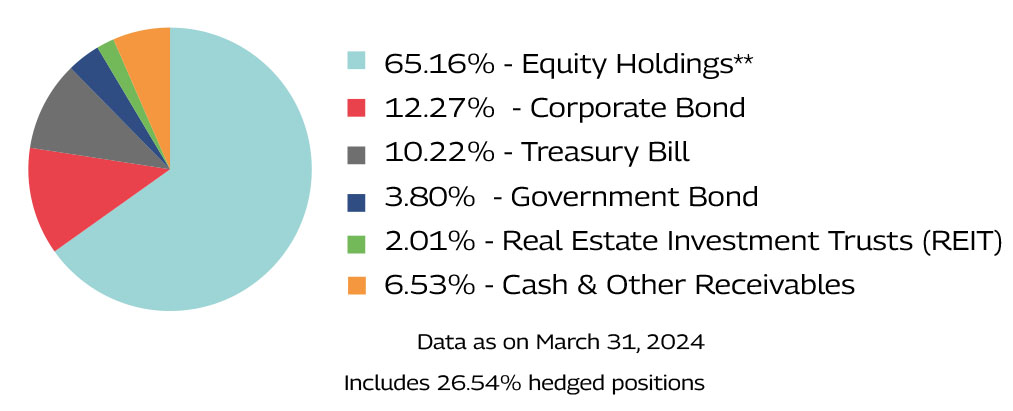
- Portfolio is around 39% invested in Equities(Unhedged)
| Sector | MMESF | Nifty Equity Savings Index TRI |
| Financial Services | 18.79% | 33.53% |
| Construction Materials | 9.13% | 2.00% |
| Information Technology | 6.10% | 13.04% |
| Fast Moving Consumer Goods | 6.07% | 8.15% |
| Oil Gas & Consumable Fuels | 4.81% | 12.87% |
^For the equity portion
Data as on March 31, 2024
| Security | % to Net Assets |
| Ambuja Cements Limited* | 7.11% |
| Bajaj Finance Limited* | 3.35% |
| ICICI Bank Limited* | 3.00% |
| HDFC Bank Limited* | 2.95% |
| ITC Limited* | 2.76% |
| Reliance Industries Limited | 2.75% |
| Sun Pharmaceutical Industries Limited* | 2.35% |
| Tech Mahindra Limited* | 2.28% |
| IndusInd Bank Limited* | 2.01% |
| Larsen & Toubro Limited | 1.90% |
| Total | 30.47% |
| Security | % to Net Assets |
| 364 Days Tbill (MD 17/10/2024) (SOV) | 2.90% |
| Kotak Mahindra Investments Limited (CB) | 2.16% |
| 182 Days Tbill (MD 04/04/2024) (SOV) | 2.15% |
| Small Industries Dev Bank of India (CB) | 2.14% |
| 364 Days Tbill (MD 19/09/2024) (SOV) | 2.08% |
| Total | 11.43% |
| Annualised Portfolio YTM*1^ | 7.41%2 |
| Macaulay Duration^ | 1.51 Year2 |
| Modified Duration^ | 1.442 |
| Residual Maturity^ | 1.79 Years2 |
| Portfolio Turnover Ratio (Last 1 year) | 4.03 |
| As on (Date) | March 31, 2024 |
| Standard Deviation | 6.06% |
| Beta | 1.16 |
| Sharpe Ratio# | 0.35 |
| Jenson’s Alpha | 0.0458 |
*In case of semi annual YTM, it will be annualised
^For debt component
#Risk-free rate assumed to be 7.90% (MIBOR as on 28-03-24) - Source: www.mmda.org
1Yield to maturity should not be construed as minimum return offered by the Scheme; 2Beta is calculated
on the basis of average monthly rolling returns as of last day of the month since inception till March 31, 2024 and annualized. 2Calculated on amount invested in debt securities (including accrued interest),
deployment of funds in TREPS and Reverse Repo and net receivable / payable.
Calculated for the period since inception till March 28, 2024. | Data Source: ICRA Analytics, Bloomberg |
Data as on March 28, 2024 | N.A.: Net Assets
| Fresh Additions | Complete Exits |
| Security | Security |
| RBL Bank Limited | - |
| Wipro Limited | - |
Note: The companies/stock(s) referred above are only for the purpose of disclosure of significant portfolio changes during the month and should not be construed as recommendation to buy/sell/ hold. The fund manager may or may
not choose to hold these companies/stocks, from time to time. Investors are requested to consult their financial, tax and other advisors before taking any investment decision(s). Data as on March 31, 2024
The Scheme seeks to generate long term capital appreciation and also income through investments in equity and equity related instruments, arbitrage opportunities and investments in debt and money market instruments. However, there can be no assurance that the investment objective of the Scheme will be achieved. The Scheme does not assure or guarantee any returns.
Fund Manager:
Mr. Manish Lodha (Equity)
Total Experience : 23 years
Experience in managing this fund: 3 years and 3 months (Managing since December 21, 2020)
Mr. Renjith Sivaram (Equity)
Total Experience : 13 years
Experience in managing this fund: 9 months (managing since July 03, 2023)
Mr. Rahul Pal (Debt)
Total Experience : 22 years,
Experience in managing this fund: 7 years and 2 months (managing since February 1, 2017)
Mr. Pranav Patel$ (Hybrid)
Total Experience: 9 years
Experience in managing this fund: 3 months (Managing since January 05, 2024)
$Dedicated Fund Manager for Overseas Investments
Date of allotment: February 1, 2017
Benchmark: Nifty Equity Savings Index TRI
Option: IDCW (IDCW Option will have IDCW Reinvestment (D) & IDCW Payout facility) and Growth (D)
D-Default
Minimum Application Amount: 1,000/- and in multiples of Re. 1/- thereafter
Minimum Additional Purchase Amount: Rs. 1,000/- and in multiples of Re. 1/- thereafter
Minimum Repurchase Amount:Rs. 1,000/- or 100 units or account balance, whichever is lower
Minimum Weekly & Monthly SIP Amount: Rs 500 and in multiples of Re. 1/- thereafter
Minimum Weekly & Monthly SIP Installments: 6
Minimum Quarterly SIP Amount: Rs 1,500 and in multiples of Re. 1/- thereafter
Minimum Quarterly SIP installments: 4
Monthly AAUM as on March 31, 2024 (Rs. in Cr.): 457.72
Quartely AAUM as on March 31, 2024 (Rs. in Cr.): 449.06
Monthly AUM as on March 31, 2024 (Rs. In Cr.): 464.80
Entry Load: Not applicable
Exit Load: 10% of the units allotted shall be redeemed without any exit load, on or before completion of 15 calendar days from the date of allotment of Units.
Any redemption in excess of the above limit shall be subject to the following exit load:
• An exit load of 1% is payable if Units are redeemed / switched-out on or before completion of 15 calendar days from the date of allotment of Units;
• Nil - If Units are redeemed / switched-out after completion of 15 calendar days from the date of allotment of Units.
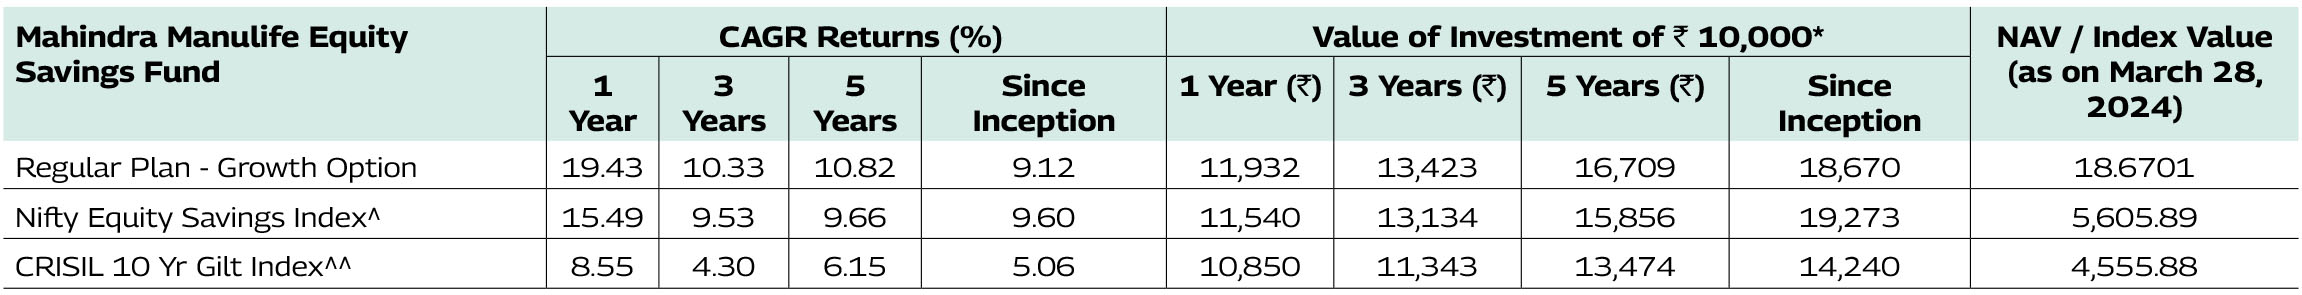
^Benchmark ^^Additional Benchmark. CAGR – Compounded Annual Growth Rate. Inception/Allotment date: 1-Feb-17.
Past performance may or may not be sustained in future and should not be used as a basis of comparison with other investments.
Since inception returns of the scheme is calculated on face value of Rs. 10 invested at inception. The performance details provided above are of Growth Option under Regular Plan. Different
Plans i.e Regular Plan and Direct Plan under the scheme has different expense structure. *Based on standard investment of Rs. 10,000 made at the beginning of the relevant period. Mr. Manish Lodha is managing this fund
since December 21, 2020. Mr. Renjith Sivaram is managing this fund since July 03, 2023. Mr. Pranav Patel is managing this fund since January 05, 2024.
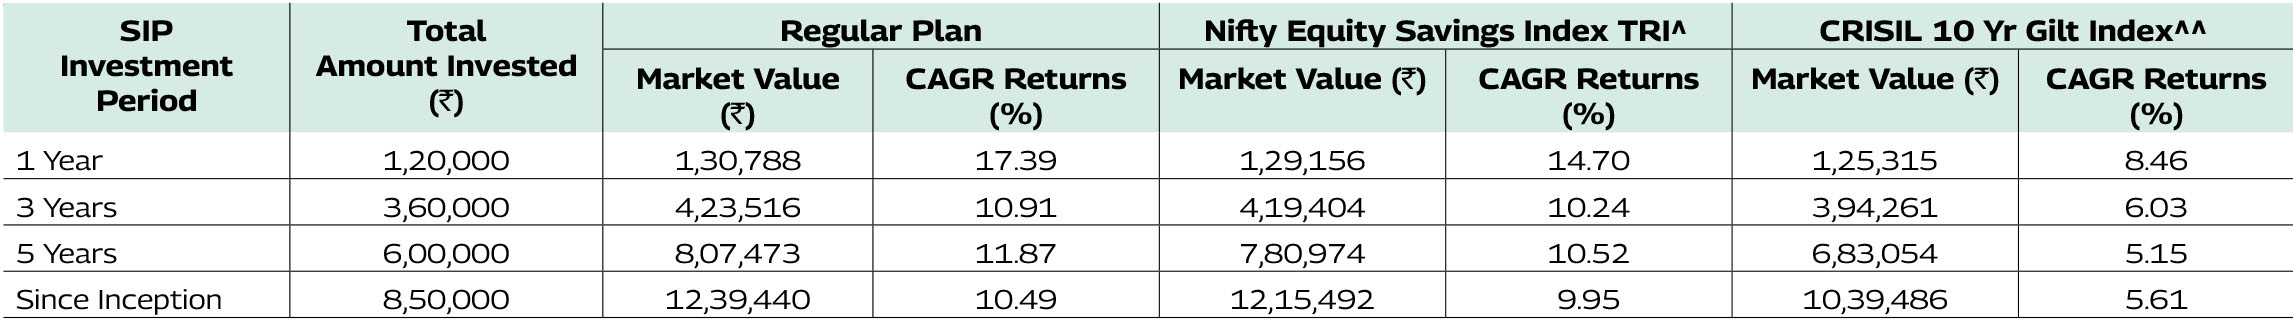
^Benchmark ^^Additional Benchmark. CAGR – Compounded Annual Growth Rate. Inception/Allotment date: 1-Feb-17.
Past performance may or may not be sustained in future and should not be used as a basis of comparison with other investments. Returns greater than 1 year period are compounded annualized. For SIP returns, monthly investment of equal amounts invested on the 1st business day of every month has been
considered. CAGR Returns (%) are computed after accounting for the cash flow by using the XIRR method (investment internal rate of return).

^Benchmark CAGR – Compounded Annual Growth Rate. #Dedicated Fund Manager for Overseas Investments
Past performance may or may not be sustained in future and should not be used as a basis of comparison with other investments.
The performance details provided above are of Growth
Option under Regular Plan Different Plans i.e Regular Plan and Direct Plan under the scheme has different expense structure. Mr. Rahul Pal manages 11 schemes, Mr. Manish Lodha manages 10
schemes, Mr. Renjith Sivaram manages 3 schemes and Mr. Pranav Patel manage 5 schemes each of Mahindra Manulife Mutual Fund. The performance data for the schemes which have not completed
one year has not been provided.
Performance as on March 28, 2024
Note: $The Benchmark of Mahindra Manulife Liquid Fund has been changed from CRISIL Liquid Debt B-I Index to CRISIL Liquid Debt A-I Index with effect from March 11, 2024. $The Benchmark of
Mahindra Manulife Ultra Short Duration Fund has been changed from CRISIL Ultra Short Duration Debt B-I Index to CRISIL Ultra Short Duration Debt A-I Index with effect from March 11, 2024.
$The Benchmark of Mahindra Manulife Low Duration Fund has been changed from CRISIL Low Duration Debt B-I Index to CRISIL Low Duration Debt A-I Index with effect from March 11, 2024. $The
Benchmark of Mahindra Manulife Short Duration Fund has been changed from CRISIL Short Duration Debt B-II Index to CRISIL Short Duration Debt A-II Index with effect from March 11, 2024. $The
Benchmark of Mahindra Manulife Dynamic Bond Fund has been changed from CRISIL Dynamic Bond B-III Index to CRISIL Dynamic Bond A-III Index with effect from March 11, 2024.
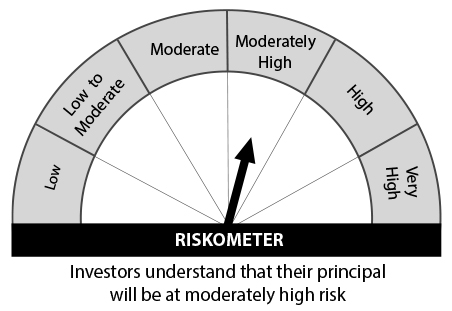
Mahindra Manulife Equity Savings Fund
This product is suitable for investors who are seeking*:
• Long term capital appreciation and generation of income
• Investment in equity and equity related instruments, arbitrage opportunities and debt and money market instruments.
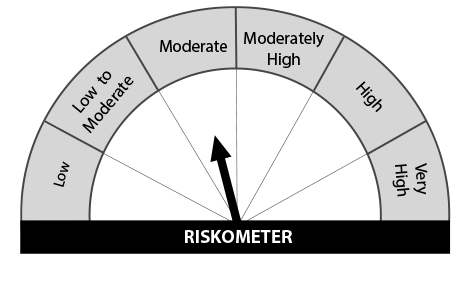
Nifty Equity Savings Index TRI
Benchmark Riskometer
*Investors should consult their financial advisers if in doubt about whether the product is suitable for them.
Get in Touch: :Unit No. 204, 2nd Floor, Amiti Building,
Piramal Agastya Corporate Park,
LBS Road, Kamani Junction, Kurla (W), Mumbai – 400 070.
Phone: +91-22-66327900, Fax: +91-22-66327932
Toll Free No.: 1800 419 6244
Website: www.mahindramanulife.com