MAHINDRA MANULIFE VALUE FUND
(An open-ended equity scheme
following a value investment strategy)
 |
 |
 |
 |
 |
| Data as on 30th June 2026 |
||||
| Investment Objective | The investment objective of the Scheme is to generate long-term capital appreciation from a diversified portfolio of predominantly equity and equity related instruments of companies which are undervalued (or are trading below their intrinsic value). However, there is no assurance that the investment objective of the Scheme will be achieved. The Scheme does not guarantee/indicate any returns |
| Fund Features | Markets (Asset Allocation): Transitional crisis or
uncertainties may create opportunities in the broader
markets Markets become cheaper, allowing for a potential increase to equity allocation across market caps in portfolio and vice versa. Sectors: Temporary changes such as price shocks in raw materials, international disruptions, government policies, regulatory changes etc. These factors may tend to hurt near term profitability and valuations without changing longer term dynamics of the sector Individual Stocks: Short term issues (on pricing, demand-supply margins), management changes, regulatory matters and business turnarounds Unlocking value through restructuring, mergers and acquisitions |
| Fund Manager and Experience | Fund Manager: Mr. Krishna Sanghavi Total Experience: 27 years Experience in managing this fund: 1 Year and 4 months (Managing since March 3, 2025) Fund Manager: Mr. Vishal Jajoo Total Experience: 17 years Experience in managing this fund: 1 Year and 4 months (Managing since March 3, 2025) |
| Date of allotment | March 3, 2025 |
| Benchmark | Nifty 500 TRI (First Tier Benchmark) |
| Options | IDCW (IDCW Option will have IDCW Reinvestment (D) & IDCW Payout facility) and Growth (D) D-Default |
| Minimum Application Amount | Rs. 1,000 and in multiples of Re. 1/- thereafter |
| Minimum Additional Purchase Amount | Rs. 1,000 and in multiples of Re. 1/- thereafter |
| SIP | Minimum Weekly & Monthly SIP Amount: Rs 500 and in
multiples of Re 1 thereafter Minimum Weekly & Monthly SIP Installments: 6 Minimum Quarterly SIP Amount: Rs 1,500 and in multiples of Re 1 thereafter Minimum Quarterly SIP installments: 4 |
| Minimum Amount for Switch in: | Rs. 1,000/- and in multiples of Re. 0.01/- thereafter. |
| Minimum Amount for Redemption / Switch-outs: | Rs. 1,000/- or 100 units or account balance, whichever is lower in respect of each Option. |
| Monthly AAUM as on June 30, 2026 (Rs. in Cr.): | 863.17 | Quarterly AAUM as on June 30, 2026 (Rs. in Cr.): | 803.99 |
| Monthly AUM as on June 30, 2026 (Rs. in Cr.): | 861.57 |
| Base Expense Ratio1 as on June 30, 2026: |
Regular Plan: 1.96% Direct Plan: 0.41% 1Base Expense Ratio excludes Brokerage Fees, Transaction Cost and other applicable statutory levies. For details of the Total Expense Ratio (TER), please refer the TER disclosure available on the website by visiting the link - https://www.mahindramanulife.com/downloads#mandatory-disclosures |
| Load Structure: | Entry Load: N.A. Exit Load (as % of NAV): An Exit Load of 0.5% is payable if Units are redeemed / switched-out up to 3 months from the date of allotment; Nil if Units are redeemed / switched-out after 3 months from the date of allotment. Redemption /Switch-Out of Units would be done on First in First Out Basis (FIFO). |
| NAV/Unit | Regular Plan (In Rs.) |
Direct Plan (In Rs.) |
| IDCW | 12.4513 |
12.7504 |
| Growth | 12.4513 |
12.7504 |
| IDCW: Income Distribution cum Capital Withdrawal. |
||
Company / Issuer |
% of Net Assets |
||
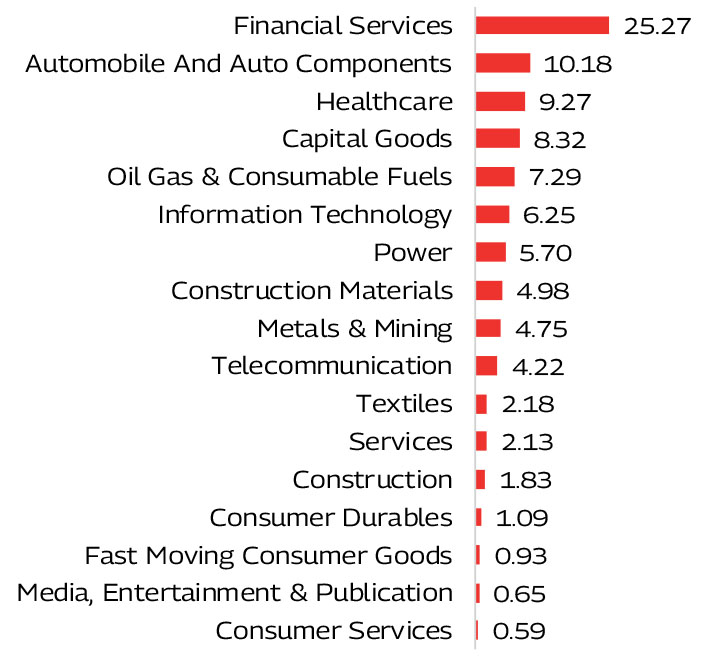
| Automobile And Auto Components | 10.18% | ||
 | Tube Investments of India Limited | 2.44% | |
| Bajaj Auto Limited | 2.18% | ||
| Shriram Pistons and Rings Ltd | 1.47% | ||
| CEAT Limited | 1.25% | ||
| Maruti Suzuki India Limited | 1.00% | ||
| Rolex Rings Limited | 0.98% | ||
| Asahi India Glass Limited | 0.86% | ||
| Capital Goods | 8.32% | ||
| Jindal Saw Limited | 1.95% | ||
| Carborundum Universal Limited | 1.56% | ||
| Voltamp Transformers Limited | 1.40% | ||
| Mazagon Dock Shipbuilders Limited | 0.90% | ||
| Kirloskar Brothers Limited | 0.90% | ||
| LMW Limited | 0.81% | ||
| Elecon Engineering Company Limited | 0.80% | ||
| Construction | 1.83% | ||
| Engineers India Limited | 1.01% | ||
| NBCC (India) Limited | 0.82% | ||
| Construction Materials | 4.98% | ||
| Grasim Industries Limited | 1.89% | ||
| Ambuja Cements Limited | 1.69% | ||
| The Ramco Cements Limited | 1.40% | ||
| Consumer Durables | 1.09% | ||
| Kajaria Ceramics Limited | 1.09% | ||
| Consumer Services | 0.59% | ||
| Aditya Birla Fashion and Retail Limited | 0.59% | ||
| Fast Moving Consumer Goods | 0.93% | ||
| Balrampur Chini Mills Limited | 0.93% | ||
| Financial Services | 25.27% | ||
| ICICI Bank Limited | 5.01% | |
| Axis Bank Limited | 2.53% | |
| IndusInd Bank Limited | 2.34% | |
| Shriram Finance Limited | 2.30% | |
| HDFC Bank Limited | 2.27% | |
| Punjab National Bank | 2.26% | |
| Bandhan Bank Limited | 2.21% | ||
| IDFC First Bank Limited | 1.65% | ||
| REC Limited | 1.40% | ||
| The Federal Bank Limited | 1.33% | ||
| Ujjivan Small Finance Bank Limited | 0.69% | ||
| Jio Financial Services Limited | 0.66% | ||
| RBL Bank Limited | 0.62% | ||
| Healthcare | 9.27% | ||
| Biocon Limited | 1.55% | ||
| Sun Pharmaceutical Industries Limited | 1.31% | ||
| Alkem Laboratories Limited | 1.30% | ||
| Zydus Lifesciences Limited | 1.24% | ||
| Aurobindo Pharma Limited | 1.20% | ||
| Cipla Limited | 1.10% | ||
| Glenmark Pharmaceuticals Limited | 0.91% | ||
| Anthem Biosciences Limited | 0.66% | ||
| Information Technology | 6.25% | ||
| Infosys Limited | 1.58% | ||
| Tech Mahindra Limited | 1.50% | ||
| Tata Consultancy Services Limited | 1.25% | ||
| Coforge Limited | 0.99% | ||
| HCL Technologies Limited | 0.93% | ||
| Media, Entertainment & Publication | 0.65% | ||
| Sun TV Network Limited | 0.65% | ||
| Metals & Mining | 4.75% | ||
| Adani Enterprises Limited | 1.67% | ||
| NMDC Limited | 1.49% | ||
| Tata Steel Limited | 0.94% | ||
| Vedanta Aluminium Metal Limited | 0.60% | ||
| Vedanta Iron And Steel Limited | 0.05% | ||
| Oil Gas & Consumable Fuels | 7.29% | ||
| Reliance Industries Limited | 2.46% | |
| Bharat Petroleum Corporation Limited | 1.02% | ||
| Coal India Limited | 0.98% | ||
| GAIL (India) Limited | 0.97% | ||
| Petronet LNG Limited | 0.94% | ||
| Hindustan Petroleum Corporation Limited | 0.88% | ||
| Vedanta Oil and Gas Ltd | 0.04% | ||
| Power | 5.70% | ||
| JSW Energy Limited | 2.78% | |
| NHPC Limited | 1.09% | ||
| CESC Limited | 0.95% | ||
| Gujarat Industries Power Company Limited | 0.83% | ||
| Vedanta Power Ltd | 0.05% | ||
| Services | 2.13% | ||
| Mahindra Logistics Limited | 1.33% | ||
| Container Corporation of India Limited | 0.80% | ||
| Telecommunication | 4.22% | ||
| Indus Towers Limited | 2.22% | |
| Vodafone Idea Limited | 2.00% | ||
| Textiles | 2.18% | ||
| K.P.R. Mill Limited | 1.19% | ||
| Gokaldas Exports Limited | 0.99% | ||
| Equity and Equity Related Total | 95.63% | ||
| Cash & Other Receivables | 4.37% | ||
| Grand Total | 100.00% | ||
| ( Top Ten Holdings - Issuer wise) as on June 30, 2026) |
|||

^Benchmark ^^Additional Benchmark. Inception/Allotment date: 03-Mar-25.
Past performance may or may not be sustained in future and should not be used as a basis of comparison with other investments.
Since inception returns of the scheme is calculated on face value of Rs. 10 invested at inception. The performance details provided above are of Growth Option under Regular and Direct Plan. Different Plans i.e Regular Plan and
Direct Plan under the scheme has different expense structure. *Based on standard investment of Rs. 10,000 made at the beginning of the relevant period. .
please click here | Best Viewed in Landscape mode

^Benchmark ^^Additional Benchmark. Inception/Allotment date: 03-Mar-25. Past performance may or may not be sustained in future and should not be used as a basis of comparison with other
investments.
Returns greater than 1 year period are compounded annualized. For SIP returns, monthly investment of equal amounts invested on the 1st business day of every month has been considered. CAGR Returns (%) are computed
after accounting for the cash flow by using the XIRR method (investment internal rate of return).
For SIP Performance please click here | Best Viewed in Landscape mode
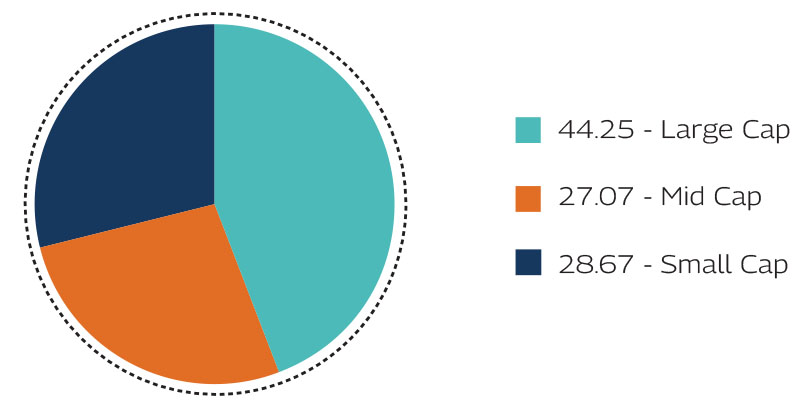
As per the latest Market Capitalisation data provided by AMFI (In line with the applicable SEBI guidelines)
Product Suitability |
|
| This Product is Suitable for investors who are seeking* | |
|
|
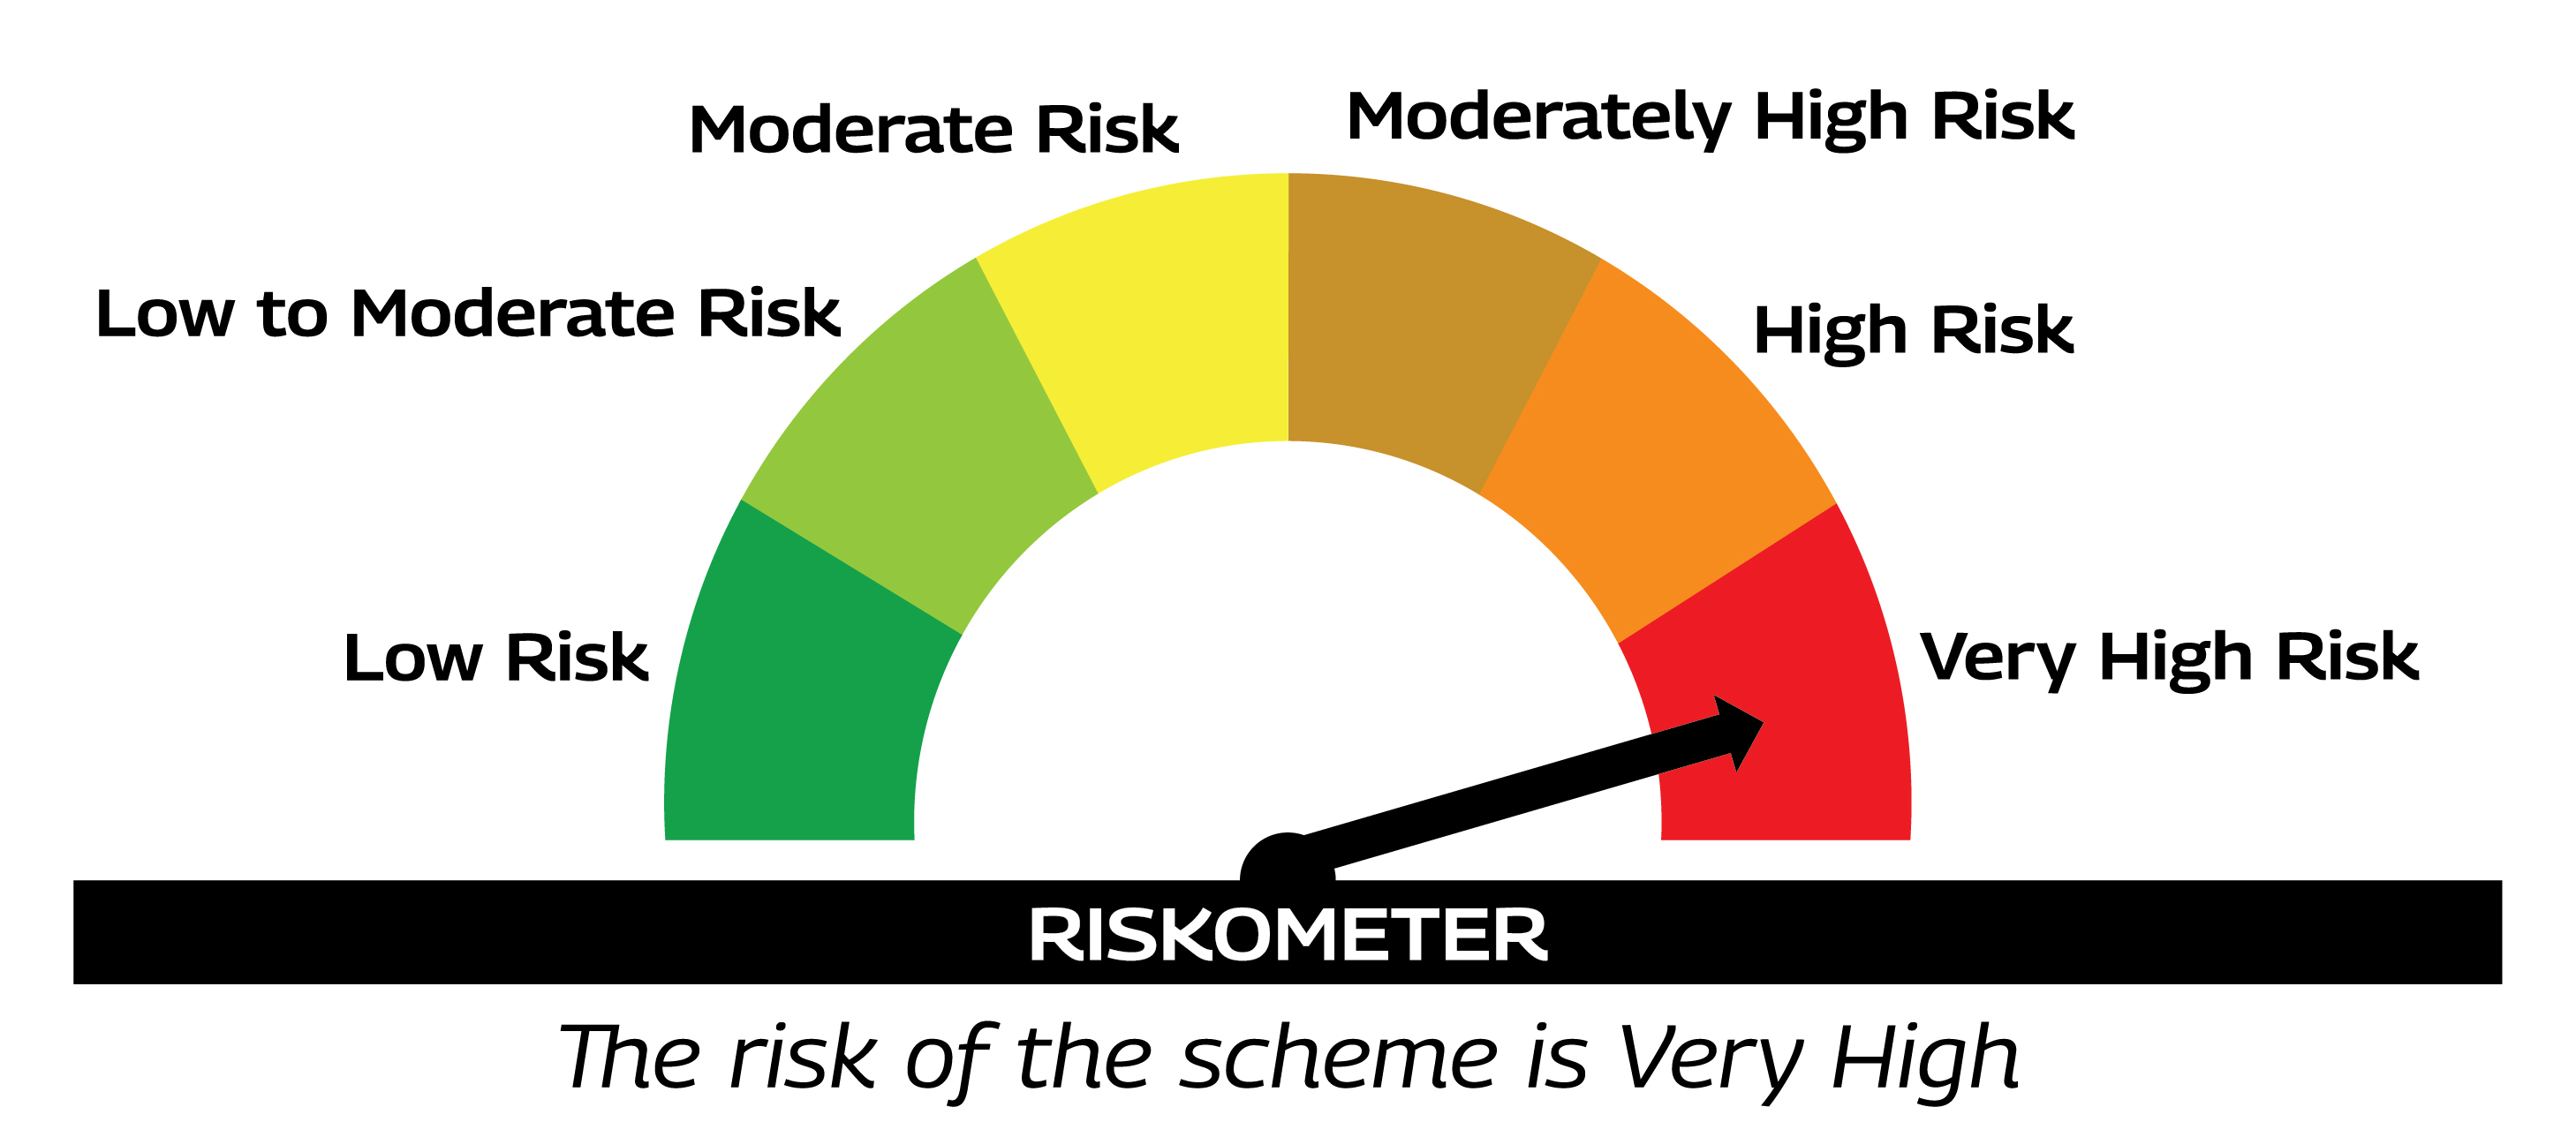
Scheme Riskometers |
Benchmark Riskometers |
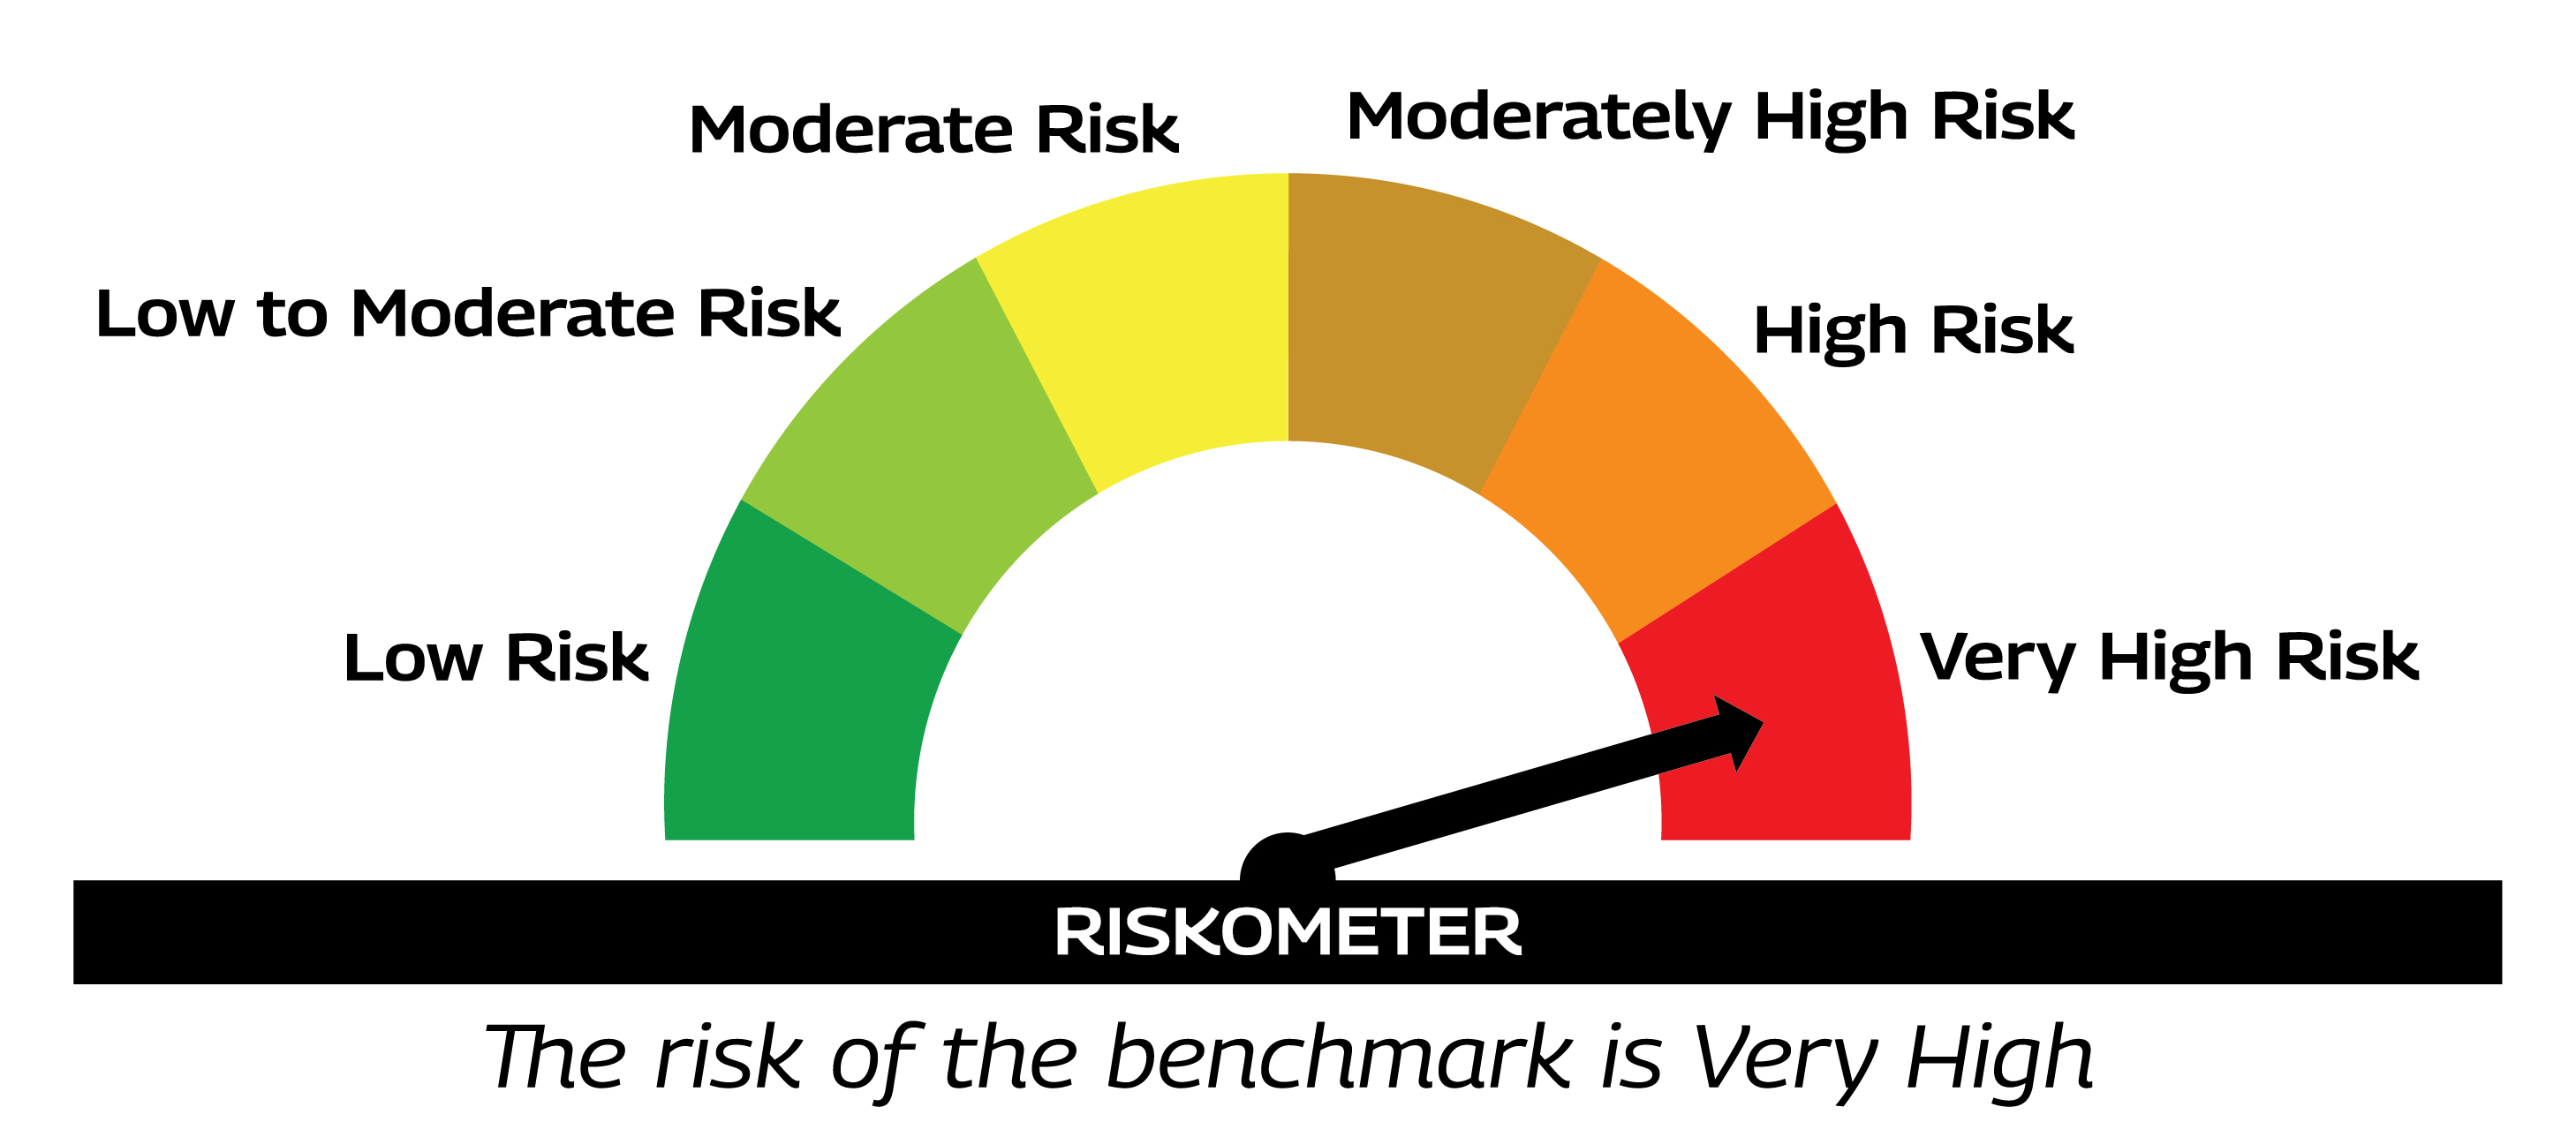 As per AMFI Tier I Benchmark i.e. Nifty 500 TRI (First Tier Benchmark) |
|
* Investors should consult their financial advisers if in doubt about whether the product is suitable for them. |
|