MAHINDRA MANULIFE ELSS TAX SAVER FUND
(An open ended equity linked saving scheme
with a statutory lock in of 3 years and tax benefit)
 |
 |
 |
 |
 |
| Data as on 31st May 2026 | ||||
| Investment Objective | The investment objective of the Scheme is to generate long term capital appreciation through a diversified portfolio of equity and equity related securities. The Scheme does not guarantee or assure any returns. |
| Fund Features | Potential Capital Appreciation: Scheme invests in a diversified equity portfolio thereby offering the investor, possibility of growing their investments. Tax Benefit: Investments in this scheme are entitled for tax deduction under section 80C. Possibility of saving upto Rs. 51,480/-*. Lock-in Feature: This feature endeavors to protect your investments from impact of short term market volatility. Lock-in of only 3 years! Other traditional tax savings options may have longer holding periods. *Assuming the investor uses the entire ₹1.50 lakh limit available under section 123 of the Income-tax Act, 2025 investing in Mahindra Manulife ELSS Tax Saver Fund. The tax benefit is calculated on the basis of current applicable tax rates under the old tax regime, ignoring marginal relief on surcharge, if any, for net taxable income between ₹50 lakh and ₹1 crore. The Income-tax Act, 2025 provides for an alternative tax regime at concessional tax rates for individual taxpayers. However, the option to avail such concessional tax regime requires the taxpayer to forego certain specified deductions, including the deduction available under section 123 of the Income-tax Act, 2025. Investors are advised to consult their financial / tax advisors before investing. |
| Fund Manager and Experience | Fund Manager: Ms. Fatema Pacha Total Experience: 18 years Experience in managing this fund: 5 years and 7 months (managing since October 16, 2020) Fund Manager: Mr. Neelesh Dhamnaskar Total Experience: 21 years Experience in managing this fund: 4 months (managing since February 16, 2026) |
| Date of allotment | October 18, 2016 |
| Benchmark | Nifty 500 TRI |
| Options | IDCW (IDCW Option will have only
IDCW Payout facility) and Growth (D) D- Default |
| Minimum Application Amount | Rs. 500 and in multiples of Rs. 500 thereafter |
| Minimum Additional Purchase Amount: | Rs. 500 and in multiples of Rs. 500 thereafter |
| Minimum Repurchase Amount: | Rs. 500 or 50 units or account balance, whichever is lower |
| SIP | Minimum Weekly & Monthly SIP Amount: Rs 500 and in multiples of Rs 500 thereafter Minimum Weekly & Monthly SIP Installments: 6 Minimum Quarterly SIP Amount: Rs 1,500 and in multiples of Rs 500 thereafter Minimum Quarterly SIP installments: 4 |
| Monthly AAUM as on May 31, 2026 (Rs. in Cr.): | 879.32 |
| Monthly AUM as on May 31, 2026 (Rs. in Cr.): | 866.77 |
| Base Expense Ratio1 as on May 31, 2026: |
Regular Plan: 1.97% Direct Plan: 0.65% 1Base Expense Ratio excludes Brokerage Fees, Transaction Cost and other applicable statutory levies. For details of the Total Expense Ratio (TER), please refer the TER disclosure available on the website by visiting the link - https://www.mahindramanulife.com/downloads#mandatory-disclosures Note: Individual taxpayers may opt for a concessional income-tax regime, subject to fulfillment of the conditions prescribed under the Income-tax Act, 2025. However, opting for such concessional tax regime requires the taxpayer to forego certain specified deductions, including the deduction available under section 123 of the Income-tax Act, 2025. |
| Load Structure: | Entry Load: N.A. Exit Load: Nil |
| Portfolio Turnover Ratio (Last 1 year): | 0.67 |
| Standard Deviation: | 14.12% |
| Beta: | 0.90 |
| Sharpe Ratio#: | 0.30 |
| Jenson’s Alpha : | -0.2568 |
| #Risk-free rate assumed to be 5.52% (MIBOR as on
29-05-2026). -
Source: www.mmda.org Note: As per AMFI guidelines for factsheet, the ratios are calculated based on month rolling returns for last 3 years. Data as on May 29, 2026 |
|
| NAV/Unit | Regular Plan (In Rs.) |
Direct Plan (In Rs.) |
| IDCW | 15.6875 |
19.8233 |
| Growth | 26.4932 |
31.4844 |
| IDCW: Income Distribution cum Capital Withdrawal. Note : As May 30 & 31, 2026 were non-business day, the NAV disclosed above is as on May 29, 2026. |
||
Company / Issuer |
% of Net Assets |
|
|---|---|---|
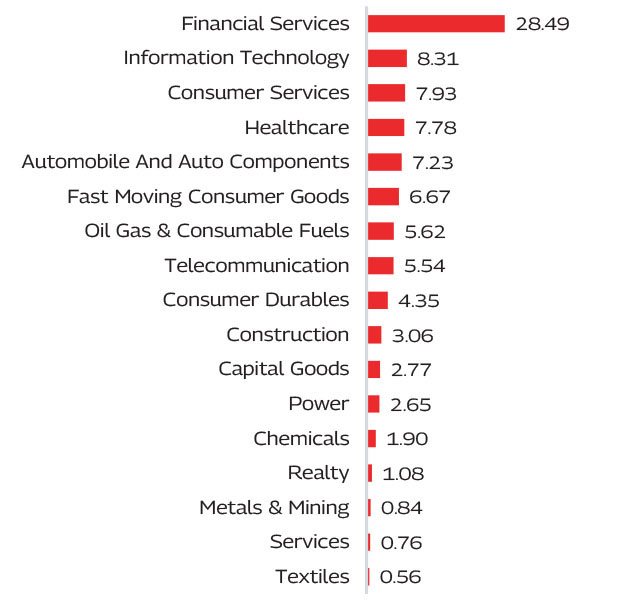
| Automobile And Auto Components | 7.23% | |
| UNO Minda Limited | 1.86% | |
| TVS Motor Company Limited | 1.83% | |
| Maruti Suzuki India Limited | 1.64% | |
| Eicher Motors Limited | 0.99% | |
| Tata Motors Passenger Vehicles Limited | 0.91% | |
| Capital Goods | 2.77% | |
| Grindwell Norton Limited | 0.92% | |
| CG Power and Industrial Solutions Limited | 0.88% | |
| Astral Limited | 0.86% | |
| Elgi Equipments Limited | 0.11% | |
| Chemicals | 1.90% | |
| Aarti Industries Limited | 0.99% | |
| Jubilant Ingrevia Limited | 0.91% | |
| Construction | 3.06% | |
 | Larsen & Toubro Limited | 3.06% |
| Consumer Durables | 4.35% | |
| Crompton Greaves Consumer Electricals Limited | 1.17% | |
| Titan Company Limited | 1.14% | |
| LG Electronics India Ltd | 1.01% | |
| Voltas Limited | 0.99% | |
| Wakefit Innovations Limited | 0.04% | |
| Consumer Services | 7.93% | |
| Avenue Supermarts Limited | 2.10% | |
| Eternal Limited | 1.66% | |
| Trent Limited | 1.41% | |
| Info Edge (India) Limited | 1.20% | |
| Jubilant Foodworks Limited | 0.81% | |
| Arvind Fashions Limited | 0.75% | |
| Fast Moving Consumer Goods | 6.67% | |
| Hindustan Unilever Limited | 2.31% |
| Britannia Industries Limited | 1.29% | |
| Nestle India Limited | 1.05% | |
| Dabur India Limited | 1.05% | |
| Doms Industries Limited | 0.97% | |
| Financial Services | 28.49% | |
| ICICI Bank Limited | 8.83% |
| HDFC Bank Limited | 7.28% |
| Bajaj Finance Limited | 3.23% |
| Axis Bank Limited | 2.24% |
| IndusInd Bank Limited | 1.83% | |
| Kotak Mahindra Bank Limited | 1.33% | |
| Tata Capital Limited | 1.27% | |
| Bandhan Bank Limited | 1.01% | |
| Shriram Finance Limited | 0.78% | |
| HDFC Life Insurance Company Limited | 0.69% | |
| Healthcare | 7.78% | |
| Dr. Reddy's Laboratories Limited | 1.68% | |
| Sun Pharmaceutical Industries Limited | 1.62% | |
| Mankind Pharma Limited | 1.56% | |
| Neuland Laboratories Limited | 1.18% | |
| Dr. Lal Path Labs Limited | 0.87% | |
| GlaxoSmithKline Pharmaceuticals Limited | 0.87% | |
| Information Technology | 8.31% | |
| Infosys Limited | 3.40% |
| Tata Consultancy Services Limited | 2.35% |
| Tech Mahindra Limited | 1.59% | |
| LTM Limited | 0.97% | |
| Metals & Mining | 0.84% | |
| Tata Steel Limited | 0.84% | |
| Oil Gas & Consumable Fuels | 5.62% | |
| Reliance Industries Limited | 3.32% |
| Oil & Natural Gas Corporation Limited | 1.53% | |
| Oil India Limited | 0.77% | |
| Power | 2.65% | |
| Tata Power Company Limited | 1.71% | |
| NTPC Limited | 0.94% | |
| Realty | 1.08% | |
| Godrej Properties Limited | 1.08% | |
| Services | 0.76% | |
| InterGlobe Aviation Limited | 0.76% | |
| Telecommunication | 5.54% | |
| Bharti Airtel Limited | 4.01% |
| Indus Towers Limited | 1.53% | |
| Textiles | 0.56% | |
| K.P.R. Mill Limited | 0.56% | |
| Equity and Equity Related Total | 95.54% | |
| Cash & Other Receivables | 4.46% | |
| Grand Total | 100.00% | |
( Top Ten Holdings - Issuer wise) as on May 31, 2026 |
||
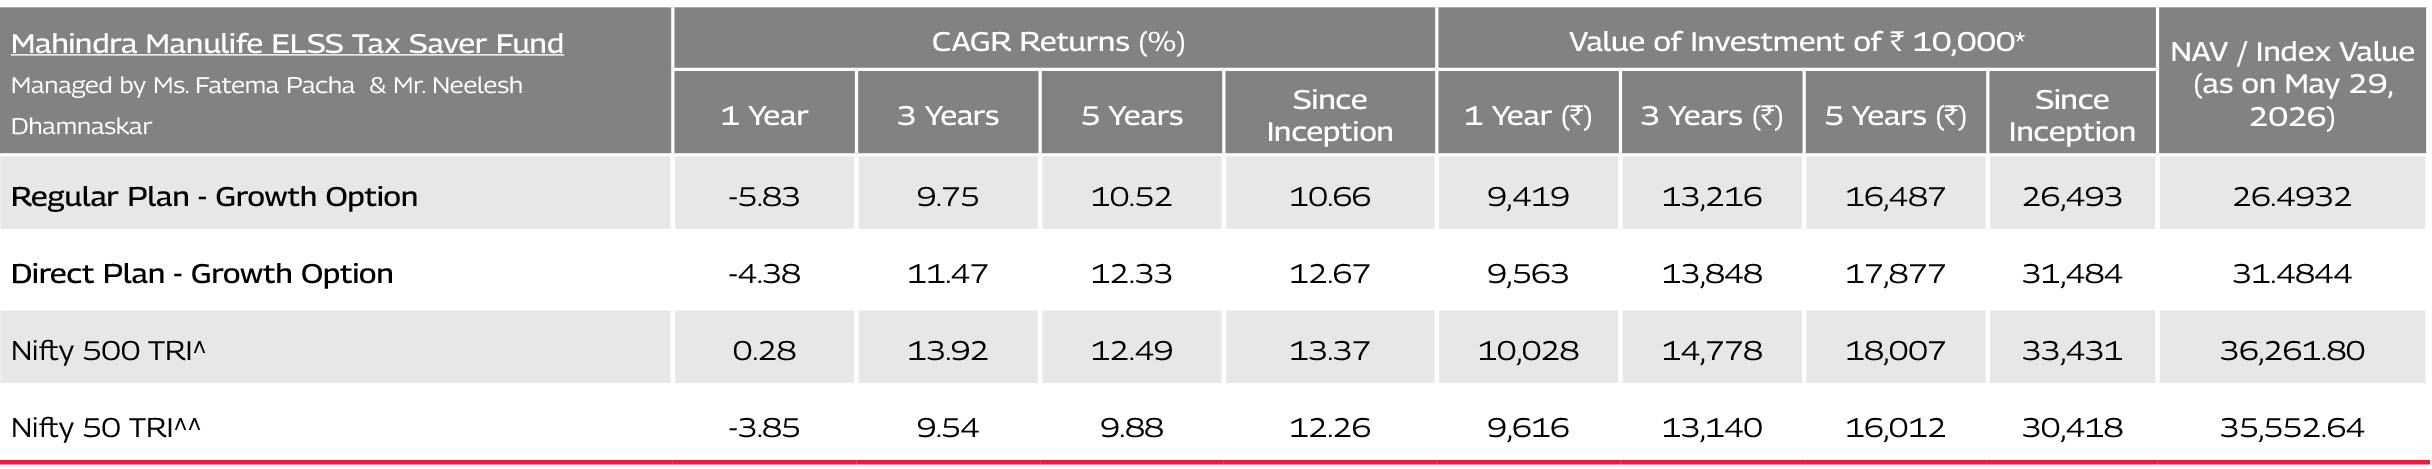
^Benchmark ^^Additional Benchmark. CAGR – Compounded Annual Growth Rate. Inception/Allotment date: 18-Oct-16. Past performance may or may not be sustained in future and should not be used as a basis of comparison with other investments.
Since inception returns of the scheme is calculated on face value of Rs. 10 invested at inception. The performance details provided above are of Growth Option under Regular and Direct Plan. Different Plans i.e Regular Plan and
Direct Plan under the scheme has different expense structure. Ms. Fatema Pacha is managing this scheme since October 16, 2020. Mr. Neelesh Dhamnaskar is managing this scheme since February 16, 2026.
*Based on standard investment of Rs. 10,000 made at the beginning of the relevant period.
For performance details of other schemes managed by the Fund Manager(s), please click here | Best Viewed in Landscape mode
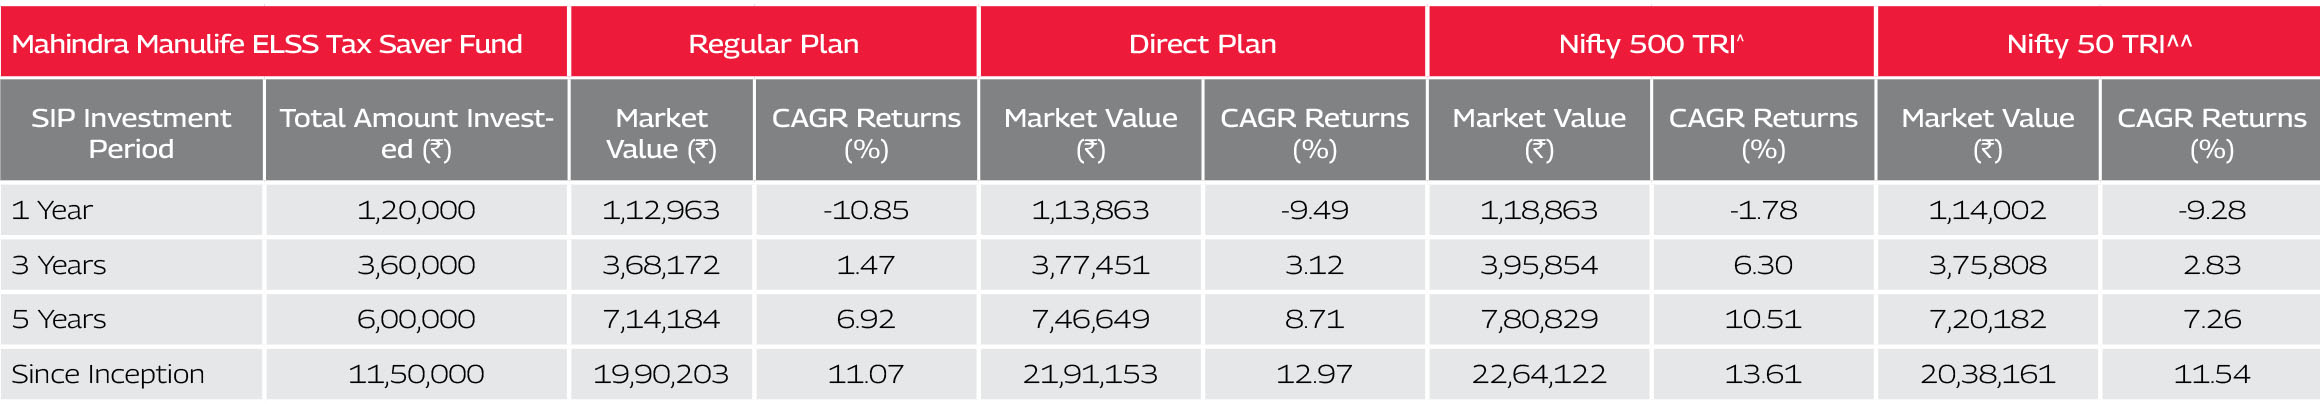
^Benchmark ^^Additional Benchmark. CAGR – Compounded Annual Growth Rate. Inception/Allotment date: 18-Oct-16. Past performance may or may not be sustained in future and should not be used as a basis of comparison with other investments.
Returns greater than 1 year period are compounded annualized. For SIP returns, monthly investment of equal amounts invested on the 1st business day of every month has been
considered. CAGR Returns (%) are computed after accounting for the cash flow by using the XIRR method (investment internal rate of return).
For SIP Performance please click here | Best Viewed in Landscape mode
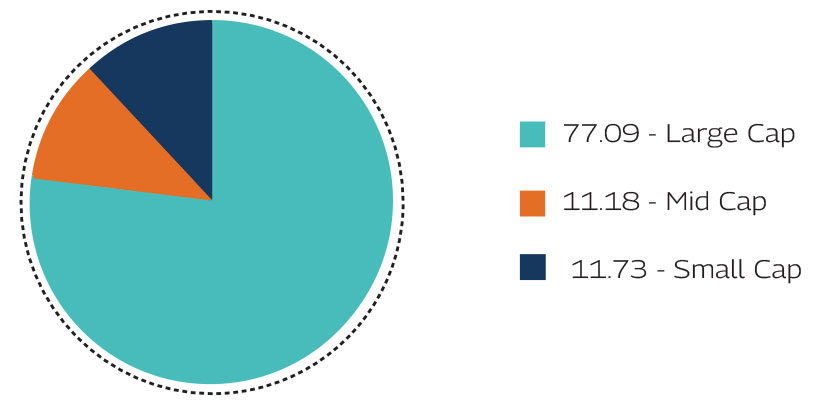
As per the latest Market Capitalisation data provided by AMFI (In line with the applicable SEBI guidelines)
Record Date |
Plan(s) / Option(s) |
IDCW |
Face Value |
Cum-IDCW NAV |
(Rs. per unit) |
(Rs. per unit) |
(Rs. per unit) |
||
14-Mar-24 |
Regular IDCW |
1.00 |
10 |
18.2013 |
14-Mar-24 |
Direct IDCW |
1.00 |
10 |
21.4077 |
13-Mar-25 |
Regular IDCW |
1.00 |
10 |
17.4288 |
13-Mar-25 |
Direct IDCW |
1.00 |
10 |
21.0123 |
10-Mar-26 |
Regular IDCW |
1.50 |
10 |
17.7861 |
10-Mar-26 |
Direct IDCW |
1.50 |
10 |
21.9996 |
IDCW: Income Distribution cum Capital Withdrawal.
Pursuant to payment of IDCW, the NAV of the IDCW Option(s) of the Scheme/Plan(s) falls to the extent of payout and statutory levy, if any. Past performance may or
may not be sustained in future and should not be used as a basis for comparison with other investments. For complete list of IDCWs, visit www.mahindramanulife.com.
Product Suitability
|
|
| This Product is Suitable for investors who are seeking* | |
|
|
Scheme Riskometers |
Benchmark Riskometers |
 As per AMFI Tier I Benchmark i.e. Nifty 500 TRI |
|
* Investors should consult their financial advisers if in doubt about whether the product is suitable for them. |
|