MAHINDRA MANULIFE MULTI ASSET ALLOCATION FUND
(An open ended scheme investing in Equity, Debt, Gold/Silver
Exchange Traded Funds (ETFs) and Exchange Traded
Commodity Derivatives)
 |
 |
 |
 |
 |
| Data as on 30th April 2026 | ||||
| Investment Objective | The investment objective of the Scheme is to seek to generate long-term capital appreciation and income by investing in equity and equity related securities, debt & money market instruments, Gold/Silver ETFs and Exchange Traded Commodity Derivatives (ETCDs) as permitted by SEBI from time to time. However, there can be no assurance that the investment objective of the Scheme will be achieved. |
| Fund Features |
Professional Asset Allocation: Asset Allocation shall be rebalanced regularly by fund managers based on evolving market dynamics Diversified Portfolio: Portfolio that aims to combine stability of fixed income, growth potential of equity and tactical exposure to gold/silver |
| Fund Manager and Experience | Fund Manager (Equity): Mr. Renjith Sivaram Total Experience: 14 years Experience in managing this fund: 2 years and 1 month (managing since March 13, 2024) Fund Manager (Debt): Mr. Rahul Pal Total Experience: 22 years Experience in managing this fund: 2 years and 1 month (managing since March 13, 2024) Fund Manager (Debt): Mr. Kush Sonigara Total Experience: 13 years Experience in managing this fund: 4 months (managing since January 01, 2026) |
| Date of allotment | March 13, 2024 |
| Benchmark | 45% NIFTY 500 TRI + 40% CRISIL Composite Bond Index + 10% Domestic Price of Physical Gold + 5% Domestic Price of Silver |
| Options | IDCW (IDCW Option will have IDCW Reinvestment (D) & IDCW Payout facility) and Growth (D) D-Default |
| Minimum Application Amount | Rs. 1,000/- and in multiples of Re. 1/- thereafter |
| Minimum Additional Purchase Amount: | Rs. 1,000/- and in multiples of Re. 1/- thereafter |
| Minimum amount for redemption/switch out: | Rs. 1,000/- or 100 units or account balance, whichever is lower |
| SIP | Minimum Weekly & Monthly SIP Amount: Rs 500 and in multiples of Re 1 thereafter Minimum Weekly & Monthly SIP Installments: 6 Minimum Quarterly SIP Amount: Rs 1,500 and in multiples of Re 1 thereafter Minimum Quarterly SIP installments: 4 |
| Monthly AAUM as on April 30, 2026 (Rs. in Cr.): | 1,077.52 |
| Monthly AUM as on April 30, 2026 (Rs. in Cr.): | 1,097.58 |
| Base Expense Ratio1 as on April 30, 2026: | Regular Plan: 1.64% Direct Plan: 0.26% 1Base Expense Ratio excludes Brokerage Fees, Transaction Cost and other applicable statutory levies. For details of the Total Expense Ratio (TER), please refer the TER disclosure available on the website by visiting the link - https://www.mahindramanulife.com/downloads#mandatory-disclosures |
| Load Structure: | Entry Load: N.A. Exit Load: ● An Exit Load of 0.5% is payable if Units are redeemed / switched-out up to 3 months from the date of allotment; ● Nil if Units are redeemed / switched-out after 3 months from the date of allotment. Redemption /Switch-Out of Units would be done on First in First out Basis (FIFO) |
| Annualised Portfolio YTM*2^: | 7.353 |
| Macaulay Duration^: | 2.24 years3 |
| Modified Duration^: | 2.11 years3 |
| Residual Maturity^: | 3.08 years3 |
| As on (Date) | April 30, 2026 |
| Portfolio Turnover Ratio (Last 1 Year): | 0.48 |
| ^For debt component *In case of semi annual YTM, it will be annualised 2Yield to maturity should not be construed as minimum return offered by the scheme; 3Calculated on amount invested in debt securities (including accrued interest), deployment of funds in TREPS and Reverse Repo and net receivable / payable. |
|
| NAV/Unit | Regular Plan (In Rs.) |
Direct Plan (In Rs.) |
| IDCW | 12.5824 |
13.0475 |
| Growth | 13.3951 |
13.8671 |
| IDCW: Income Distribution cum Capital Withdrawal. |
||
Company / Issuer |
Rating |
% of Net Assets |
||
|---|---|---|---|---|
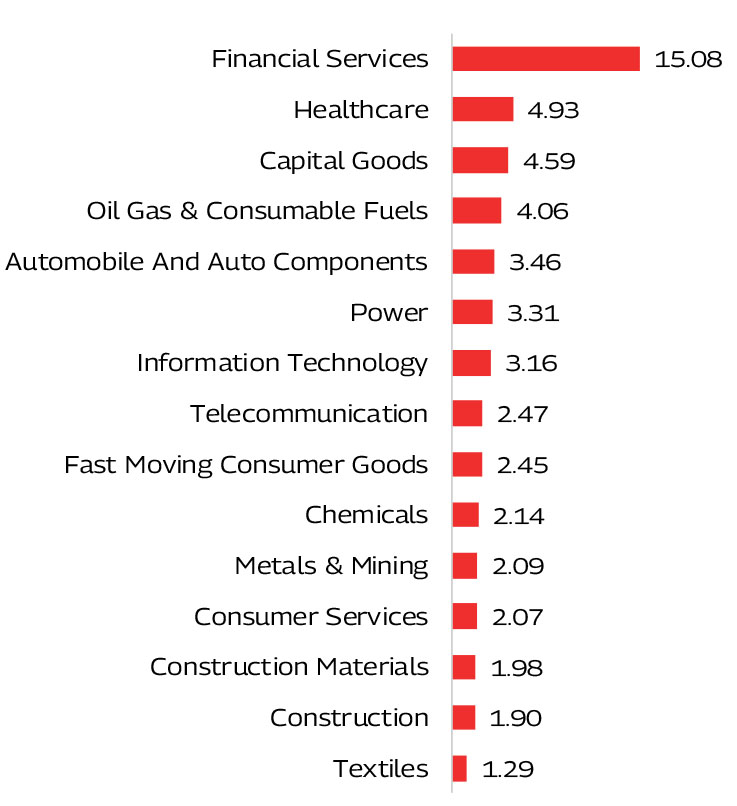
| Automobile And Auto Components | 3.46% | |||
| Shriram Pistons and Rings Ltd | 1.16% | |||
| Mahindra & Mahindra Limited | 1.03% | |||
| Maruti Suzuki India Limited | 0.65% | |||
| LG Balakrishnan & Bros Limited | 0.62% | |||
| Capital Goods | 4.59% | |||
| PTC Industries Limited | 0.74% | |||
| Inox India Limited | 0.74% | |||
| Hindustan Aeronautics Limited | 0.70% | |||
| Kirloskar Brothers Limited | 0.64% | |||
| Carborundum Universal Limited | 0.60% | |||
| Technocraft Industries (India) Limited | 0.60% | |||
| Tega Industries Limited | 0.57% | |||
| Chemicals | 2.14% | |||
| Coromandel International Limited | 1.11% | |||
| Archean Chemical Industries Limited | 0.55% | |||
| SRF Limited | 0.48% | |||
| Construction | 1.90% | |||
| Larsen & Toubro Limited | 1.15% | |||
| ISGEC Heavy Engineering Limited | 0.75% | |||
| Construction Materials | 1.98% | |||
| Grasim Industries Limited | 0.73% | |||
| Shree Cement Limited | 0.68% | |||
| JK Cement Limited | 0.57% | |||
| Consumer Services | 2.07% | |||
| Aditya Vision Ltd | 1.24% | |||
| Eternal Limited | 0.83% | |||
| Fast Moving Consumer Goods | 2.45% | |||
| ITC Limited | 0.76% | |||
| Tata Consumer Products Limited | 0.64% | |||
| Triveni Engineering & Industries Limited | 0.53% | |||
| Hindustan Unilever Limited | 0.52% | |||
| Financial Services | 15.08% | |||
 | HDFC Bank Limited | 3.86% | ||
| ICICI Bank Limited | 2.86% | ||
| State Bank of India | 2.00% | ||
| Axis Bank Limited | 1.42% | ||
| Bajaj Finance Limited | 0.91% | |||
| Kotak Mahindra Bank Limited | 0.88% | |||
| L&T Finance Limited | 0.78% | |||
| Shriram Finance Limited | 0.75% | |||
| Nippon Life India Asset Management Limited | 0.60% | |||
| SBI Life Insurance Company Limited | 0.55% | |||
| Union Bank of India | 0.47% | |||
| Healthcare | 4.93% | |||
| Divi's Laboratories Limited | 1.57% | ||
| Sun Pharmaceutical Industries Limited | 1.16% | |||
| Acutaas Chemicals Limited | 0.92% | |||
| Anthem Biosciences Limited | 0.73% | |||
| Gland Pharma Limited | 0.55% | |||
| Information Technology | 3.16% | |||
| Infosys Limited | 1.30% | ||
| Tech Mahindra Limited | 1.08% | |||
| Persistent Systems Limited | 0.78% | |||
| Metals & Mining | 2.09% | |||
| Tata Steel Limited | 1.17% | |||
| Hindalco Industries Limited | 0.92% | |||
| Oil Gas & Consumable Fuels | 4.06% | |||
| Reliance Industries Limited | 2.66% | ||
| Oil & Natural Gas Corporation Limited | 0.81% | |||
| GAIL (India) Limited | 0.59% | |||
| Power | 3.31% | |||
| NTPC Limited | 1.28% | ||
| Tata Power Company Limited | 1.22% | |||
| Power Grid Corporation of India Limited | 0.81% | |||
| Realty | 3.83% | |||
| Brookfield India Real Estate Trust | 2.17% | ||
| Embassy Office Parks REIT | 0.92% | |||
| Nexus Select Trust - REIT | 0.74% | |||
| Telecommunication | 2.47% | |||
| Bharti Airtel Limited | 2.47% | ||
| Textiles | 1.29% | |||
| S. P. Apparels Limited | 0.73% | |||
| K.P.R. Mill Limited | 0.56% | |||
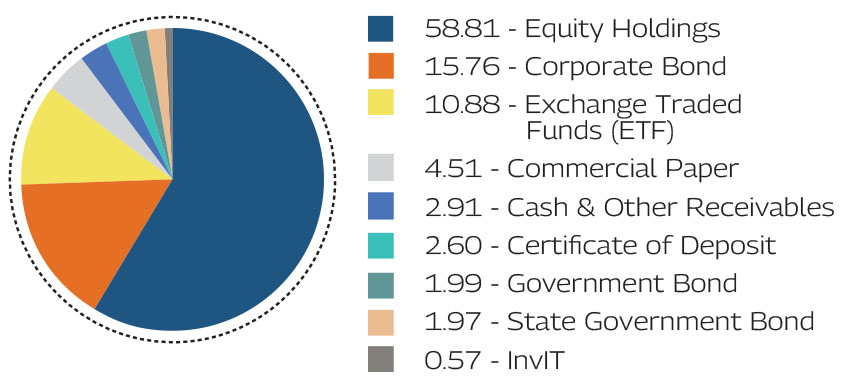
| Equity & Equity Related Total | 58.81% | |||
| Exchange Traded Funds (ETF) | 10.88% | |||
| ICICI Prudential Gold ETF | 9.64% | |||
| Nippon India Silver ETF | 1.24% | |||
| Certificate of Deposit | 2.60% | |||
| Union Bank of India | ICRA A1+ | 2.15% | ||
| Bank of Baroda | FITCH A1+ | 0.45% | ||
| Commercial Paper | 4.51% | |||
| ICICI Securities Limited | CRISIL A1+ | 4.51% | ||
| Corporate Bond | 15.76% | |||
| Bajaj Finance Limited | CRISIL AA+ | 3.60% | ||
| TVS Credit Services Limited | CRISIL AA+ | 2.29% | ||
| Muthoot Finance Limited | CRISIL AA+ | 2.29% | ||
| Bharti Telecom Limited | CRISIL AAA | 1.80% | ||
| Power Finance Corporation Limited | CRISIL AAA | 1.36% | ||
| National Bank For Agriculture and Rural Development | CRISIL AAA | 1.36% | ||
| LIC Housing Finance Limited | CRISIL AAA | 0.91% | ||
| Godrej Industries Limited | CRISIL AA+ | 0.78% | ||
| Kotak Mahindra Investments Limited | CRISIL AAA | 0.46% | ||
| Small Industries Dev Bank of India | CRISIL AAA | 0.46% | ||
| 360 One Prime Limited | ICRA AA | 0.23% | ||
| Sundaram Finance Limited | ICRA AAA | 0.22% | ||
| Government Bond | 1.99% | |||
| 6.68% GOI (MD 07/07/2040) | SOV | 1.55% | ||
| 7.24% GOI (MD 18/08/2055) | SOV | 0.44% | ||
| InvIT | 0.57% | |||
| Raajmarg Infra Investment Trust | 0.57% | |||
| State Government Bond | 1.97% | |||
| 6.98% Maharashtra SDL (MD 25/06/2037) | SOV | 1.07% | ||
| 7.63% Maharashtra SDL (MD 31/01/2036) | SOV | 0.46% | ||
| 7.25% Maharashtra SDL (MD 12/11/2037) | SOV | 0.44% | ||
| Cash & Net Receivables/(Payables) | 2.91% | |||
| Grand Total | 100.00% | |||
|
*Includes Real Estate Investment Trusts (REIT) ( Top Ten Holdings - Issuer wise) as on April 30, 2026) |
||||
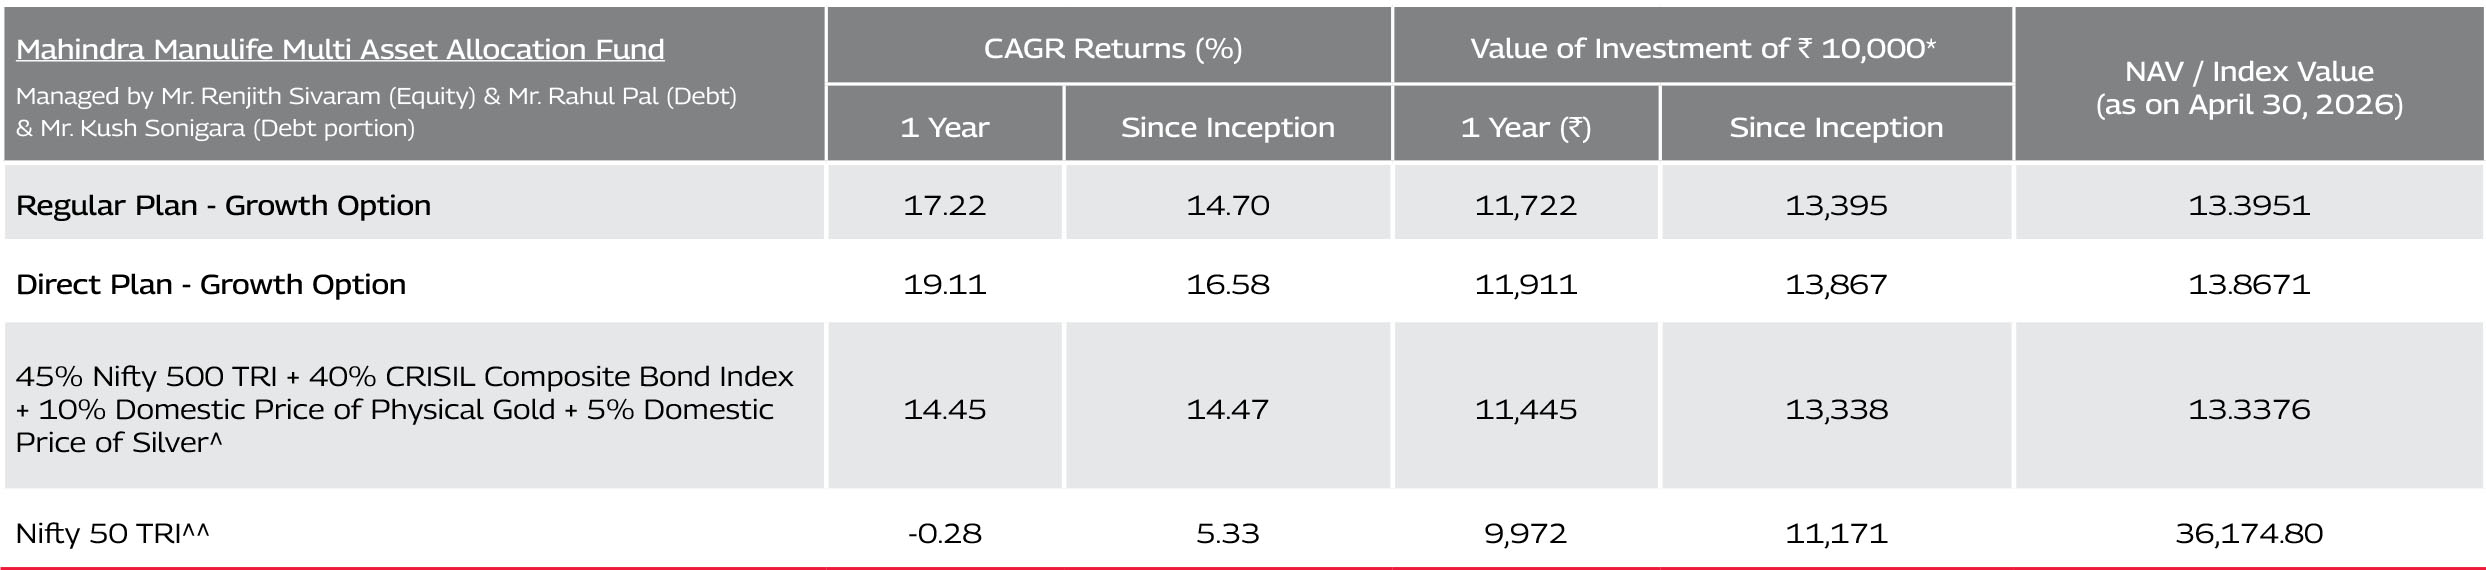
^Benchmark ^^Additional Benchmark. CAGR – Compounded Annual Growth Rate. Inception/Allotment date: 13-Mar-24.
Past performance may or may not be sustained in future and should not be used as a basis of comparison with other investments.
Since inception returns of the scheme is calculated on face value of Rs. 10 invested at inception. The performance details provided above are of Growth Option under Regular and Direct Plan. Different Plans i.e Regular Plan and
Direct Plan under the scheme has different expense structure. *Based on standard investment of Rs. 10,000 made at the beginning of the relevant period. Mr. Kush Sonigara is managing this fund since January 01, 2026.
For performance details of other schemes managed by the Fund Manager(s), please click here | Best Viewed in Landscape mode
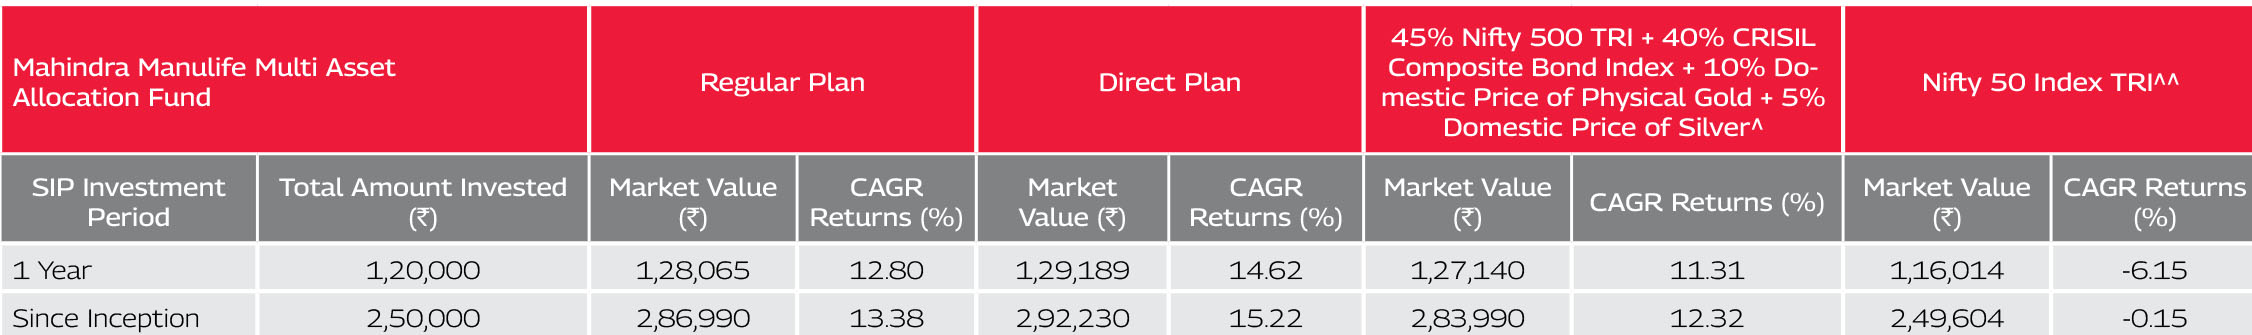
^Benchmark ^^Additional Benchmark. CAGR – Compounded Annual Growth Rate. Inception/Allotment date: 13-Mar-24.
Past performance may or may not be sustained in future and should not be used as a basis of comparison with other investments.
Returns greater than 1 year period are compounded annualized. For SIP returns, monthly investment of equal amounts invested on the 1st business day of every month has been considered. CAGR Returns (%) are computed
after accounting for the cash flow by using the XIRR method (investment internal rate of return).
| For SIP Performance please click here |
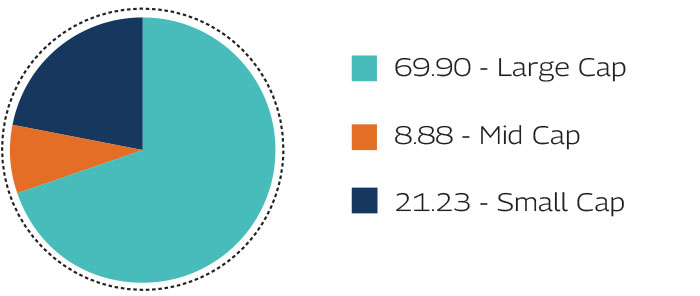
As per the latest Market Capitalisation data provided by AMFI (In line with the applicable SEBI guidelines)
Record Date |
Plan(s) / Option(s) |
IDCW |
Face Value |
Cum-IDCW NAV |
(Rs. per unit) |
(Rs. per unit) |
(Rs. per unit) |
||
13-Mar-25 |
Regular IDCW |
0.25 |
10 |
10.8887 |
13-Mar-25 |
Direct IDCW |
0.25 |
10 |
11.0667 |
10-Mar-26 |
Regular IDCW |
0.50 |
10 |
13.0871 |
10-Mar-26 |
Direct IDCW |
0.50 |
10 |
13.5207 |
Note: Pursuant to payment of IDCW, the NAV of the IDCW Option(s) of the Scheme/Plan(s) falls to the extent of payout and statutory levy, if any. Past performance may or may not be sustained in future and should not be used as a basis for comparison with other investments.
For complete list of IDCWs, visit www.mahindramanulife.com.
Product Suitability |
|
| This Product is Suitable for investors who are seeking* | |
|
|
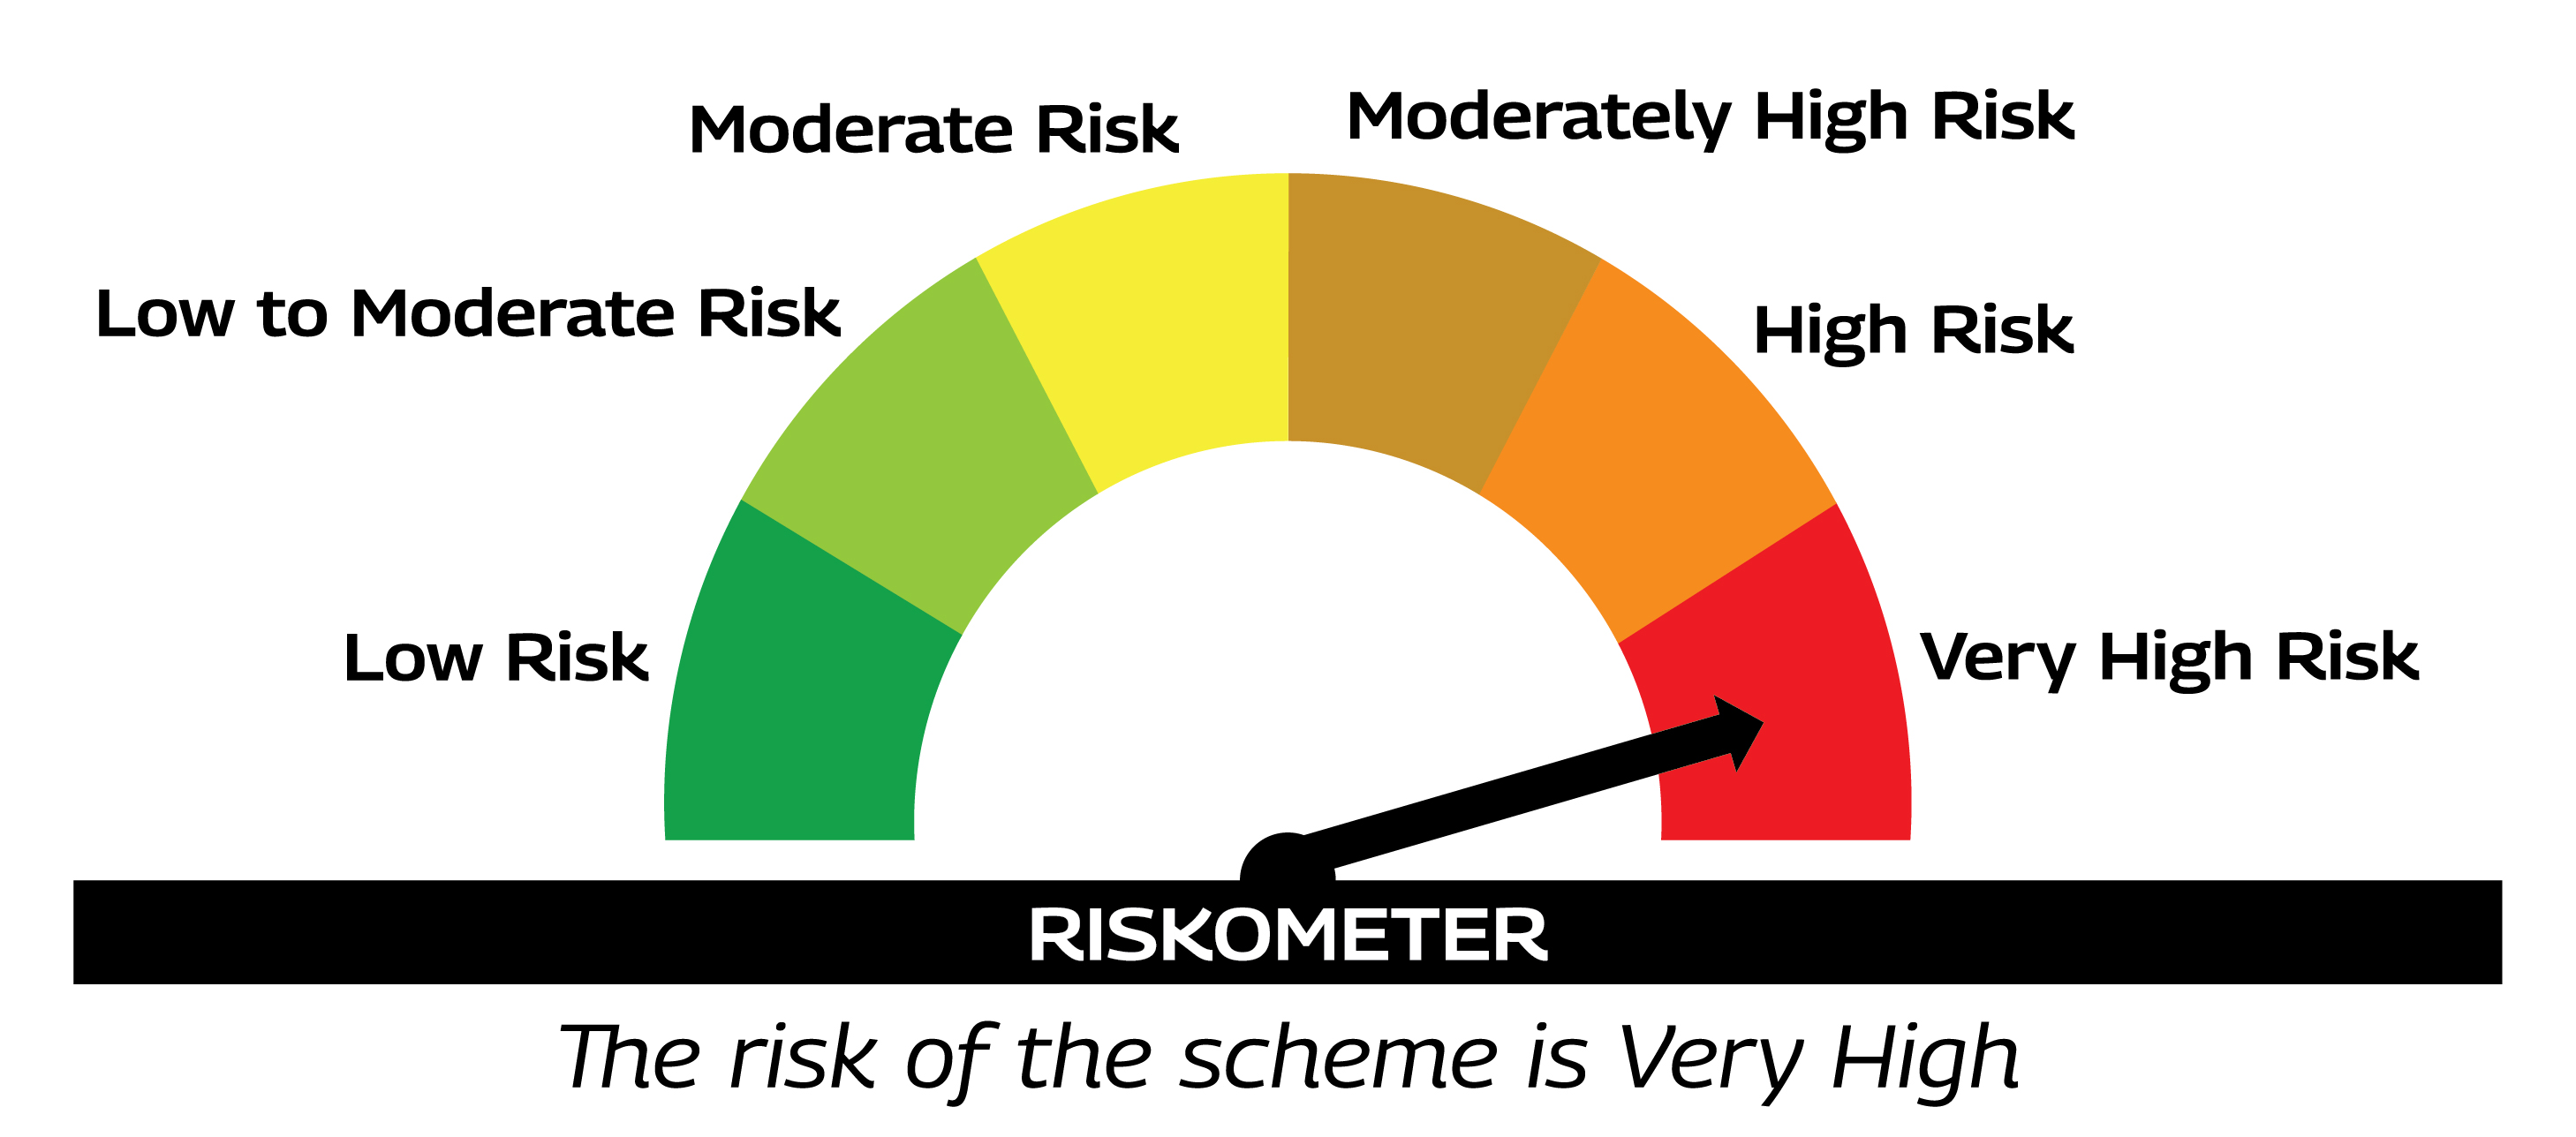
Scheme Riskometers |
Benchmark Riskometers |
 |
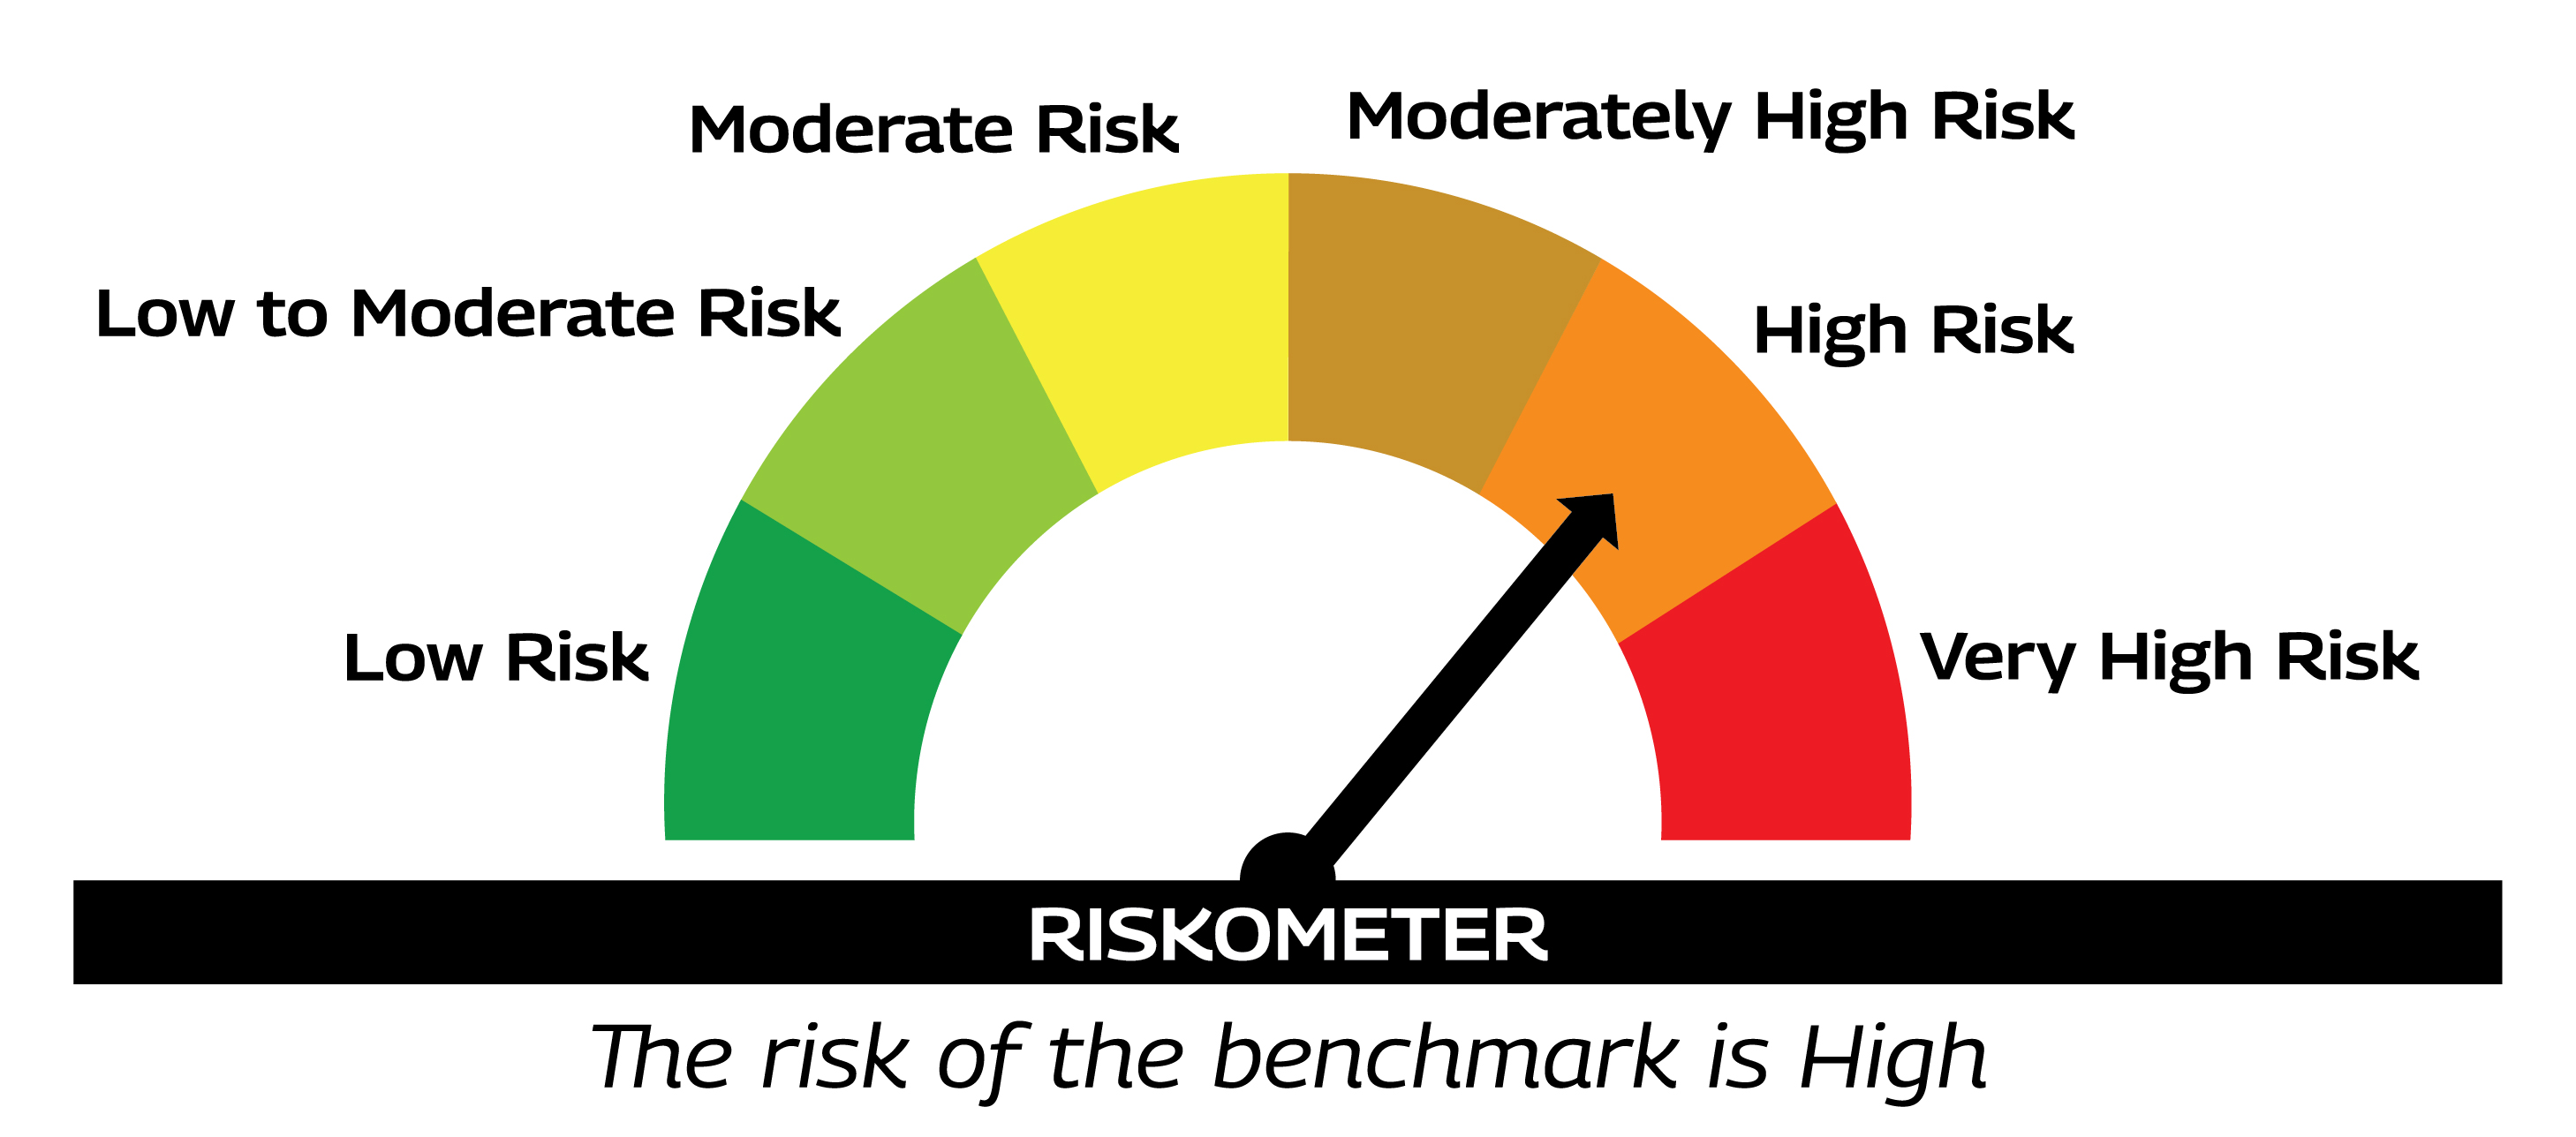 As per AMFI Tier I Benchmark i.e. 45% NIFTY 500 TRI + 40% CRISIL Composite Bond Index + 10% Domestic Price of Physical Gold + 5% Domestic Price of Silver |
* Investors should consult their financial advisers if in doubt about whether the product is suitable for them. |
|