022 6632 7900 / 1800 419 6244
MON TO FRI :
(9:00 AM TO 6:00 PM)
022 6632 7900 / 1800 419 6244
MSIF

Mahindra Manulife Flexi Cap Fund

Mahindra Manulife Flexi Cap Fund

Suitable for

LONG TERM CAPITAL APPRECIATION

Experience the Freedom to Invest Across Market Caps

Mahindra Manulife Flexi Cap Fund

(An open ended dynamic equity scheme investing across large cap, mid cap, small cap stocks)

An open ended dynamic equity scheme investing across large cap, mid cap, small cap stocks

Mahindra Manulife Flexi Cap Fund

Direct Plan • Growth Option

Asset Class-Equity

Very High Risk
As on 27-10-2026

16.33

Returns

Scheme CAGR

Data as on 30-09-2026
(Since Inception)

10.72%

Benchmark CAGR

Data as on 30-09-2026
(Since Inception)

10.53%

Fund option

Plan

Total AUM

As of 30-09-2026

₹1,509.58 Cr

Scheme age

Inception 23-08-2021

5 Years 2 Months

Scheme benchmark

Nifty 500 TRI

Min. investment

₹1,000

Min. SIP

₹500

Lock in

0 year

No

Exit load

Yes*

See details

Risk profile

Very High

*Exit load

An Exit Load of 1% is payable if Units are redeemed / switched-out upto 3 months from the date of allotment;
» Nil if Units are redeemed / switched-out after 3 months from the date of allotment.

Investment Objective

The investment objective of the Scheme is to generate long term capital appreciation by investing in a diversified portfolio of equity and equity-related securities across market capitalization. However, there can be no assurance that the investment objective of the Scheme will be achieved.

Why Invest In This Scheme

  • Flexibility to invest in opportunities across market capitalization
  • Bottom up stock selection process
  • Active allocation across Market capitalization based on macro-economic indicators, policy environment, valuations, market conditions
  • Top down approach to select sectors
  • Management through diversification of holdings and disciplined approach to monitor individual stock position based on market capitalization

Scheme Performance

Mahindra Manulife Flexi Cap FundCAGR Returns (%)Value Of Investment Of 10,000* (₹)Nav / Index Value
(As On 30-09-2026)
Managed by Ms. Kirti Dalvi & Mr. Neelesh Dhamnaskar1 Year3 Years5 YearsSince Inception1 Year3 Years5 YearsSince Inception
Regular Plan - Growth Option-3.857.558.528.779,61512,44515,05115,36015.36
Direct Plan - Growth Option-2.349.3210.4510.729,76613,07116,44316,82016.82
Nifty 500 TRI^-2.039.509.0410.539,79713,13515,41816,67335,505.86
Nifty 50 TRI^^-7.096.056.377.639,29111,93113,62114,55534,371.66
^Benchmark ^^Additional Benchmark. CAGR – Compounded Annual Growth Rate. Inception/Allotment date: 23-Aug-21.
Past performance may or may not be sustained in future and should not be used as a basis of comparison with other investments. Since inception returns of the scheme is calculated on face value of Rs. 10 invested at inception. The performance details provided above are of Growth Option under Regular and Direct Plan. Different Plans i.e Regular Plan and Direct Plan under the scheme has different expense structure. Ms. Kirti Dalvi is managing this scheme since July 21, 2026. Mr. Neelesh Dhamnaskar is managing the scheme since February 16, 2026. *Based on standard investment of Rs. 10,000 made at the beginning of the relevant period.

Asset Allocation (%)

Pie chart: Equity Holdings 96.84%; Cash & Other Receivables 3.16%

Equity Holdings
96.84%
Cash & Other Receivables
3.16%

Rating Profile (%)

Pie chart: Equity 96.84%; Cash & Other Receivables 3.16%

Equity
96.84%
Cash & Other Receivables
3.16%

Sector Allocation (%)

Pie chart: Financial Services 28.78%; Healthcare 12.91%; Capital Goods 9.99%; Automobile and Auto Components 6.79%; Consumer Services 6.20%; Information Technology 4.07%; Services 3.64%; Construction 3.51%; Telecommunication 3.38%; Oil Gas & Consumable Fuels 3.15%; Consumer Durables 2.93%; Metals & Mining 2.90%; Fast Moving Consumer Goods 2.49%; Power 2.44%; Chemicals 2.14%; Construction Materials 1.01%; Textiles 0.50%

Financial Services
28.78%
Healthcare
12.91%
Capital Goods
9.99%
Automobile and Auto Components
6.79%
Consumer Services
6.20%
Information Technology
4.07%
Services
3.64%
Construction
3.51%
Telecommunication
3.38%
Oil Gas & Consumable Fuels
3.15%
Consumer Durables
2.93%
Metals & Mining
2.90%
Fast Moving Consumer Goods
2.49%
Power
2.44%
Chemicals
2.14%
Construction Materials
1.01%
Textiles
0.50%

Market Capitalization (%)

Pie chart: Large Cap 53.05%; Mid Cap 22.46%; Small Cap 24.49%

Large Cap
53.05%
Mid Cap
22.46%
Small Cap
24.49%
Data as on 30-09-2026

Top 10 Issuers

Data as on

30-09-2026

Security% To Net AssetsSecurity% To Net Assets
ICICI Bank Limited6.44%Bajaj Finance Limited2.38%
HDFC Bank Limited3.93%Larsen & Toubro Limited2.02%
Axis Bank Limited2.55%Kotak Mahindra Bank Limited1.92%
Eternal Limited2.50%The Federal Bank Limited1.91%
Bharti Airtel Limited2.49%Reliance Industries Limited1.81%
Security
% To Net Assets
ICICI Bank Limited
6.44%
HDFC Bank Limited
3.93%
Axis Bank Limited
2.55%
Eternal Limited
2.50%
Bharti Airtel Limited
2.49%
Bajaj Finance Limited
2.38%
Larsen & Toubro Limited
2.02%
Kotak Mahindra Bank Limited
1.92%
The Federal Bank Limited
1.91%
Reliance Industries Limited
1.81%
Total: 27.95%

Top 5 Sectors Of The Scheme

SectorMMFCF*Nifty 500 TRI
Financial Services28.78%30.58%
Healthcare12.91%7.31%
Capital Goods9.99%7.5%
Automobile and Auto Components6.79%7.42%
Consumer Services6.20%4.07%
MMFCF*-Mahindra Manulife Flexi Cap Fund
Data as on 30-09-2026

Fund Managers

  • Mr. Neelesh Dhamnaskar

    Mr. Neelesh Dhamnaskar

    Total Experience:

    21+ years of experience in Indian equity markets

    Experience in managing this fund:
    Managing since February 16, 2026 (0 years 8 months)
  • Ms.Kirti Dalvi

    Ms.Kirti Dalvi

    Total Experience:

    19+ years of experience in the field of financial sector.

    Experience in managing this fund:
    Managing since July 21, 2026 (0 years 3 months)

Scheme Documents And Forms

Riskometer

This Product is Suitable for investors who are seeking

  • Long term capital appreciation.
  • Investment in diversified portfolio of equity & equity related instruments across market capitalization.
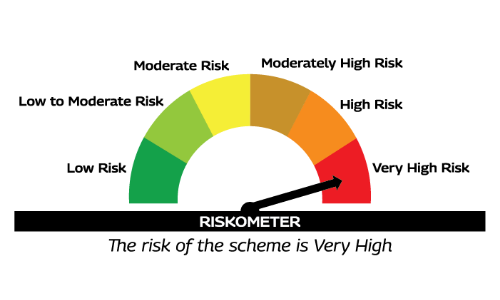
Scheme Riskometer
Mahindra Manulife- Scheme Risko Meter Very High
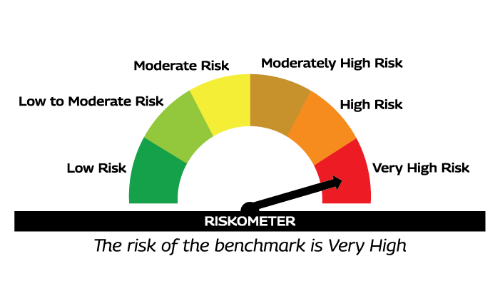
Benchmark Riskometer

As per AMFI Tier I Benchmark i.e.

Nifty 500 TRI

Mahindra Manulife- Benchmark Risko Meter Very High

Investor should consult their financial advisers if in doubt about whether the product is suitable for them.

Mutual Fund investments are subject to market risks, read all scheme related documents carefully.

Welcome to the new Mahindra Manulife Mutual Fund experience